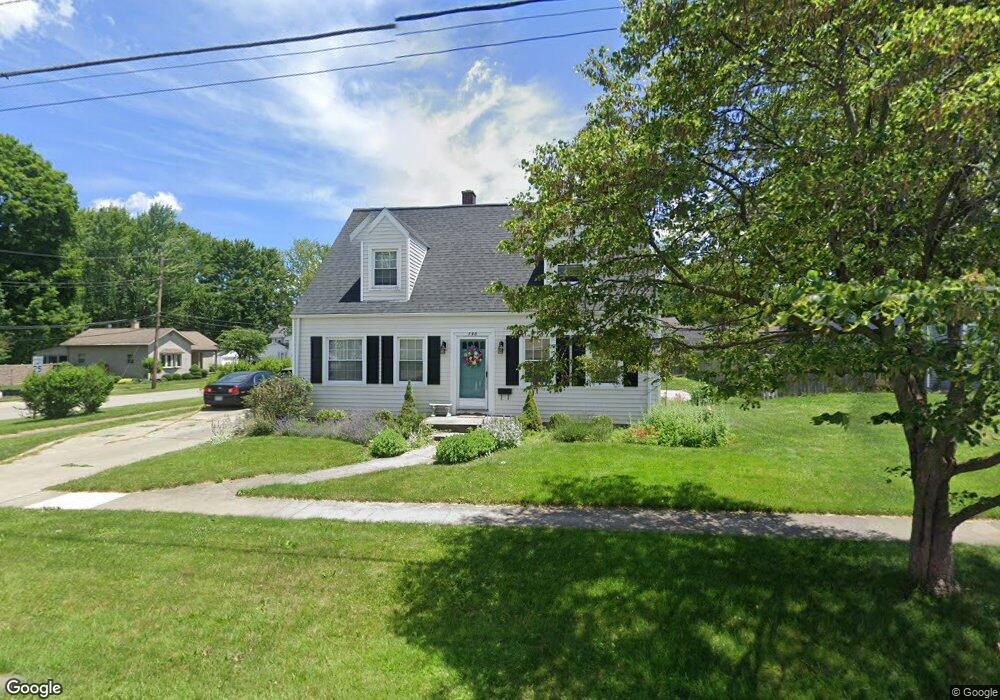
798 N Vine St Fostoria, OH 44830
Estimated Value: $146,000 - $166,000
3
Beds
2
Baths
1,486
Sq Ft
$103/Sq Ft
Est. Value
About This Home
This home is located at 798 N Vine St, Fostoria, OH 44830 and is currently estimated at $153,616, approximately $103 per square foot. 798 N Vine St is a home located in Hancock County with nearby schools including Fostoria Intermediate Elementary School and Fostoria Junior/Senior High School.
Ownership History
Date
Name
Owned For
Owner Type
Purchase Details
Closed on
Jun 9, 2017
Bought by
Dawn T Tsantles
Current Estimated Value
Purchase Details
Closed on
Nov 18, 1981
Bought by
Tsantles Stephen A and Tsantles Dawn
Create a Home Valuation Report for This Property
The Home Valuation Report is an in-depth analysis detailing your home's value as well as a comparison with similar homes in the area
Home Values in the Area
Average Home Value in this Area
Purchase History
| Date | Buyer | Sale Price | Title Company |
|---|---|---|---|
| Dawn T Tsantles | -- | -- | |
| Tsantles Stephen A | -- | -- |
Source: Public Records
Tax History Compared to Growth
Tax History
| Year | Tax Paid | Tax Assessment Tax Assessment Total Assessment is a certain percentage of the fair market value that is determined by local assessors to be the total taxable value of land and additions on the property. | Land | Improvement |
|---|---|---|---|---|
| 2024 | $1,945 | $39,080 | $4,970 | $34,110 |
| 2023 | $1,941 | $39,080 | $4,970 | $34,110 |
| 2022 | $2,114 | $39,080 | $4,970 | $34,110 |
| 2021 | $1,649 | $29,320 | $4,950 | $24,370 |
| 2020 | $1,656 | $29,320 | $4,950 | $24,370 |
| 2019 | $1,648 | $25,600 | $4,310 | $21,290 |
| 2018 | $1,476 | $25,600 | $4,310 | $21,290 |
| 2017 | $738 | $25,600 | $4,310 | $21,290 |
| 2016 | $1,297 | $25,600 | $4,310 | $21,290 |
| 2015 | $1,169 | $23,170 | $3,440 | $19,730 |
| 2014 | $1,194 | $23,680 | $3,440 | $20,240 |
| 2012 | $1,425 | $28,120 | $3,440 | $24,680 |
Source: Public Records
Map
Nearby Homes
- 603 N Vine St
- 901 Central Ave
- 723 N Union St
- 892 N Countyline St
- 900 N Countyline St
- 931 N Union St
- 520 N Union St
- 509 College Ave
- 727 Eisenhower Dr
- 203 N Union St
- 207 W Culbertson St
- 634 W Tiffin St
- 633 Maple St
- 375 Thomas St
- 1324 N Union St
- 348 W South St
- 351 W South St
- 411 Monticello Dr
- 425 W Ridge Dr Unit U5
- 220 E High St