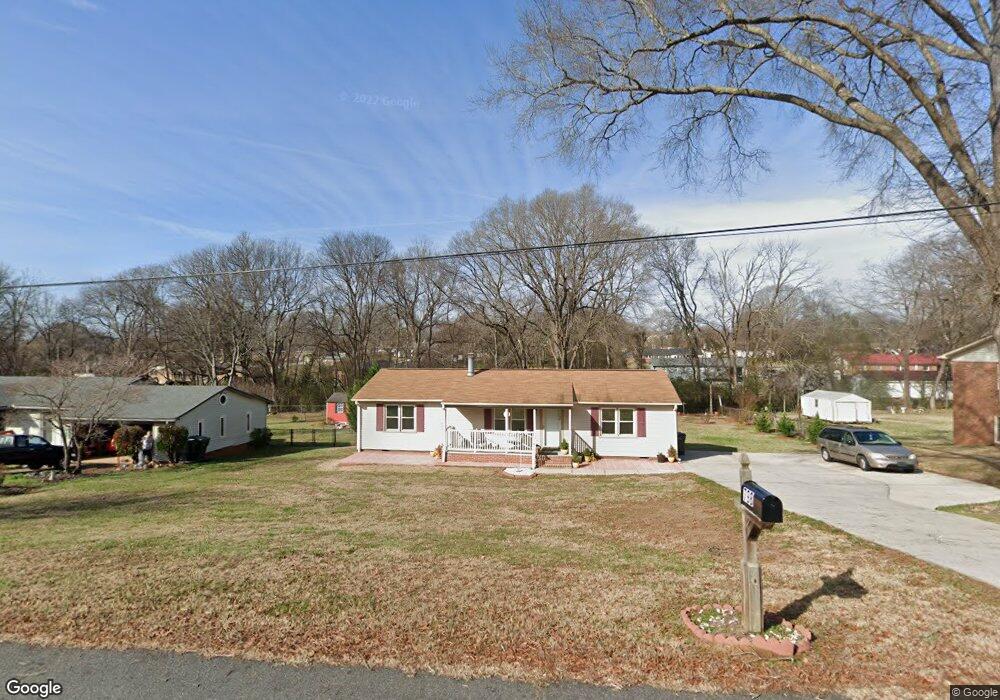
798 Rubens Rd SW Concord, NC 28027
Estimated Value: $168,178 - $269,000
3
Beds
2
Baths
1,248
Sq Ft
$186/Sq Ft
Est. Value
About This Home
This home is located at 798 Rubens Rd SW, Concord, NC 28027 and is currently estimated at $231,795, approximately $185 per square foot. 798 Rubens Rd SW is a home located in Cabarrus County with nearby schools including Wolf Meadow Elementary School, J.N. Fries Middle School, and Branch Christian Academy Concord.
Ownership History
Date
Name
Owned For
Owner Type
Purchase Details
Closed on
Nov 13, 2013
Sold by
Bratton Randy L and Bratton Ruth C
Bought by
Villagrana Fausto and Villagrana Alma
Current Estimated Value
Purchase Details
Closed on
Apr 28, 2005
Sold by
Hartsell Jeffrey K and Barringer James T
Bought by
Bratton Randy L and Bratton Ruth C
Home Financials for this Owner
Home Financials are based on the most recent Mortgage that was taken out on this home.
Original Mortgage
$67,500
Interest Rate
5.88%
Mortgage Type
Fannie Mae Freddie Mac
Purchase Details
Closed on
Jun 10, 1998
Sold by
B & B Properties Of Concord Inc
Bought by
Seagraves Robin B
Home Financials for this Owner
Home Financials are based on the most recent Mortgage that was taken out on this home.
Original Mortgage
$37,500
Interest Rate
6.88%
Create a Home Valuation Report for This Property
The Home Valuation Report is an in-depth analysis detailing your home's value as well as a comparison with similar homes in the area
Home Values in the Area
Average Home Value in this Area
Purchase History
| Date | Buyer | Sale Price | Title Company |
|---|---|---|---|
| Villagrana Fausto | $82,500 | None Available | |
| Bratton Randy L | $75,000 | -- | |
| Seagraves Robin B | $33,500 | -- |
Source: Public Records
Mortgage History
| Date | Status | Borrower | Loan Amount |
|---|---|---|---|
| Previous Owner | Bratton Randy L | $67,500 | |
| Previous Owner | Seagraves Robin B | $37,500 |
Source: Public Records
Tax History Compared to Growth
Tax History
| Year | Tax Paid | Tax Assessment Tax Assessment Total Assessment is a certain percentage of the fair market value that is determined by local assessors to be the total taxable value of land and additions on the property. | Land | Improvement |
|---|---|---|---|---|
| 2025 | $1,159 | $232,770 | $66,000 | $166,770 |
| 2024 | $1,159 | $232,770 | $66,000 | $166,770 |
| 2023 | $728 | $119,420 | $38,000 | $81,420 |
| 2022 | $723 | $118,490 | $38,000 | $80,490 |
| 2021 | $361 | $118,490 | $38,000 | $80,490 |
| 2020 | $723 | $118,490 | $38,000 | $80,490 |
| 2019 | $547 | $89,590 | $23,000 | $66,590 |
| 2018 | $538 | $89,590 | $23,000 | $66,590 |
| 2017 | $529 | $89,590 | $23,000 | $66,590 |
| 2016 | $314 | $85,840 | $23,000 | $62,840 |
| 2015 | $1,116 | $85,840 | $23,000 | $62,840 |
| 2014 | $1,116 | $96,230 | $23,000 | $73,230 |
Source: Public Records
Map
Nearby Homes
- 818 Rubens Rd SW
- 1132 Rembrandt Dr SW
- 3294 Shining Rock St SW
- 1239 Kent Downs Ave SW
- 1220 Kent Downs Ave SW
- 1030 Van Gogh Dr SW
- 1022 Van Gogh Dr SW
- 1398 Kent Downs Ave SW Unit 52
- 3673 Farm Lake Dr SW
- 3174 Farmwood Blvd SW Unit 154
- 2694 Woodcrest Dr SW
- 3011 Langhorne Ave SW
- 1255 Old Charlotte Rd
- 668 Jackson Terrace SW
- 664 Jackson Terrace SW
- 3133 Roberta Rd
- 1067 Old Charlotte Rd
- 3913 Stough Rd
- 4104 Pebblebrook Cir SW
- 4110 Pebblebrook Cir SW
- 802 Rubens Rd SW
- 799 Rubens Rd SW
- 795 Rubens Rd SW
- 803 Rubens Rd SW
- 806 Rubens Rd SW
- 790 Rubens Rd SW
- 807 Rubens Rd SW
- 791 Rubens Rd SW
- 1093 Rembrandt Dr SW
- 1085 Rembrandt Dr SW
- 810 Rubens Rd SW
- 786 Rubens Rd SW
- 786 Rubens Rd SW
- 787 Rubens Rd SW
- 1079 Rembrandt Dr SW
- 811 Rubens Rd SW
- 1097 Rembrandt Dr SW
- 814 Rubens Rd SW
- 1073 Rembrandt Dr SW
- 782 Rubens Rd SW