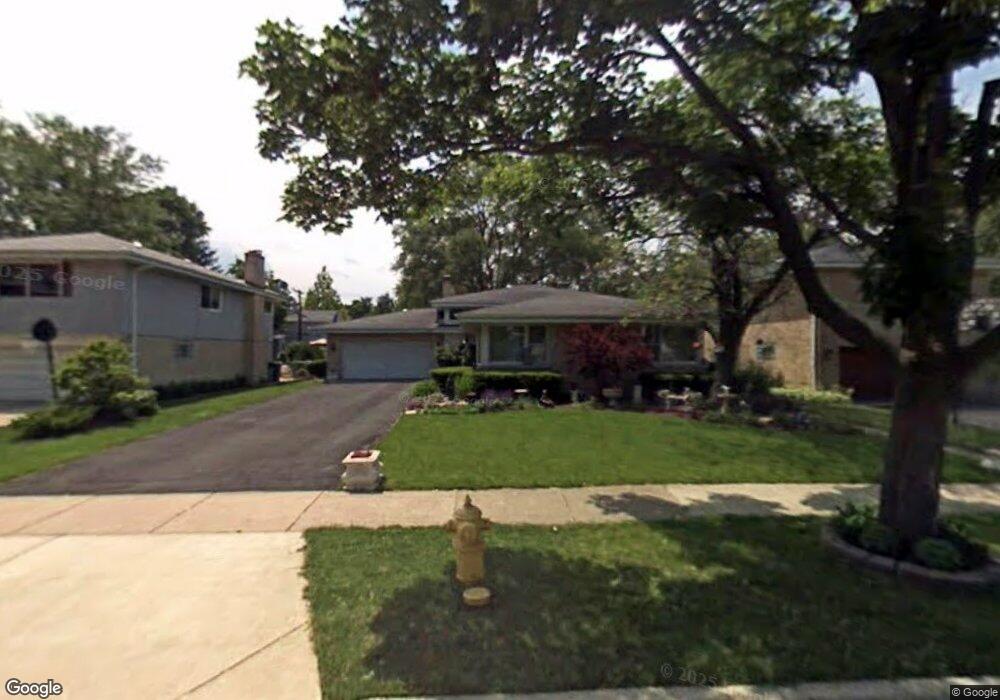
798 S Saylor Ave Elmhurst, IL 60126
Estimated Value: $675,150 - $713,000
Studio
--
Bath
1,742
Sq Ft
$395/Sq Ft
Est. Value
About This Home
This home is located at 798 S Saylor Ave, Elmhurst, IL 60126 and is currently estimated at $688,788, approximately $395 per square foot. 798 S Saylor Ave is a home located in DuPage County with nearby schools including Jackson Elementary School, Bryan Middle School, and York Community High School.
Ownership History
Date
Name
Owned For
Owner Type
Purchase Details
Closed on
Oct 19, 2018
Sold by
Demirdjian John Paul and Demirdjian Kristen A
Bought by
Demirdjian John Paul and Demirdjian Kristen A
Current Estimated Value
Purchase Details
Closed on
Mar 7, 2014
Sold by
Demirdjian Karnig A and Demirdjian Valentina L
Bought by
Demirdjian John Paul
Home Financials for this Owner
Home Financials are based on the most recent Mortgage that was taken out on this home.
Original Mortgage
$417,001
Outstanding Balance
$307,967
Interest Rate
3.68%
Mortgage Type
Adjustable Rate Mortgage/ARM
Estimated Equity
$380,821
Purchase Details
Closed on
Nov 20, 2012
Sold by
Demirdjian Karnig and Demirdjian Valentina
Bought by
Demirdjian Karnig A and Demirdjian Valentina L
Purchase Details
Closed on
Jul 24, 1996
Sold by
Rusnak Ronald J and Rusnak Gay E
Bought by
Demirjian Karnig and Demirdjian Valentina
Home Financials for this Owner
Home Financials are based on the most recent Mortgage that was taken out on this home.
Original Mortgage
$62,000
Interest Rate
7.87%
Create a Home Valuation Report for This Property
The Home Valuation Report is an in-depth analysis detailing your home's value as well as a comparison with similar homes in the area
Home Values in the Area
Average Home Value in this Area
Purchase History
| Date | Buyer | Sale Price | Title Company |
|---|---|---|---|
| Demirdjian John Paul | -- | None Available | |
| Demirdjian John Paul | $417,500 | Alliance Title Corporation | |
| Demirdjian Karnig A | -- | None Available | |
| Demirjian Karnig | $282,500 | -- |
Source: Public Records
Mortgage History
| Date | Status | Borrower | Loan Amount |
|---|---|---|---|
| Open | Demirdjian John Paul | $417,001 | |
| Previous Owner | Demirjian Karnig | $62,000 |
Source: Public Records
Tax History
| Year | Tax Paid | Tax Assessment Tax Assessment Total Assessment is a certain percentage of the fair market value that is determined by local assessors to be the total taxable value of land and additions on the property. | Land | Improvement |
|---|---|---|---|---|
| 2024 | $12,282 | $211,803 | $103,858 | $107,945 |
| 2023 | $11,405 | $195,860 | $96,040 | $99,820 |
| 2022 | $11,054 | $188,300 | $92,330 | $95,970 |
| 2021 | $10,781 | $183,610 | $90,030 | $93,580 |
| 2020 | $10,365 | $179,590 | $88,060 | $91,530 |
| 2019 | $10,148 | $170,740 | $83,720 | $87,020 |
| 2018 | $9,907 | $165,910 | $79,260 | $86,650 |
| 2017 | $9,691 | $158,100 | $75,530 | $82,570 |
| 2016 | $9,489 | $148,940 | $71,150 | $77,790 |
| 2015 | $9,396 | $138,750 | $66,280 | $72,470 |
| 2014 | $8,689 | $123,750 | $52,600 | $71,150 |
| 2013 | $8,600 | $125,490 | $53,340 | $72,150 |
Source: Public Records
Map
Nearby Homes
- 868 S Spring Rd
- 742 S Saylor Ave
- 849 S Swain Ave
- 769 S Prospect Ave
- 696 S Prospect Ave
- 769 S Fairview Ave
- 878 S Parkside Ave
- 722 S Berkley Ave
- 936 S Mitchell Ave
- 663 S Hawthorne Ave
- 680 S Bryan St
- 881 S Bryan St
- 611 S Prospect Ave
- 857 S Euclid Ave
- 594 S Fairfield Ave
- 570 S Parkside Ave
- 593 S Sunnyside Ave
- 602 S Sunnyside Ave
- 906 S Kirk Ave
- 606 S York St
- 794 S Saylor Ave
- 804 S Saylor Ave
- 790 S Saylor Ave
- 810 S Saylor Ave
- 791 S Spring Rd
- 795 S Saylor Ave
- 786 S Saylor Ave
- 791 S Saylor Ave
- 799 S Saylor Ave
- 803 S Saylor Ave
- 809 S Spring Rd
- 787 S Spring Rd
- 813 S Spring Rd
- 781 S Spring Rd
- 787 S Saylor Ave
- 782 S Saylor Ave
- 818 S Saylor Ave
- 813 S Saylor Ave
- 783 S Saylor Ave
- 817 S Spring Rd
Your Personal Tour Guide
Ask me questions while you tour the home.