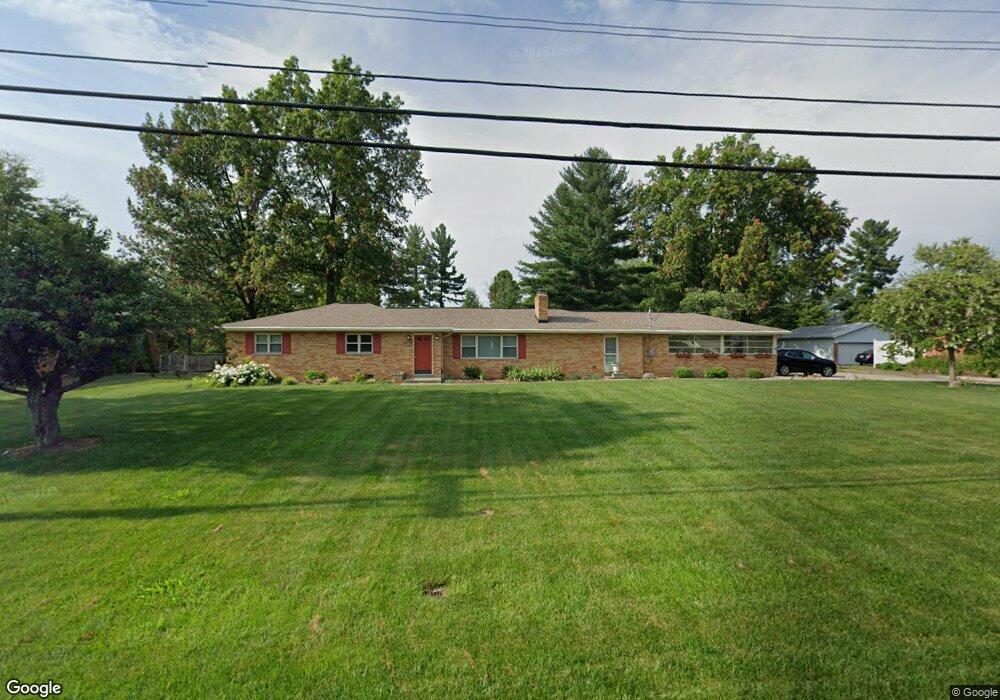
7988 Dimmick Rd Cincinnati, OH 45241
West Chester Township NeighborhoodEstimated Value: $368,000 - $455,000
3
Beds
3
Baths
2,078
Sq Ft
$197/Sq Ft
Est. Value
About This Home
This home is located at 7988 Dimmick Rd, Cincinnati, OH 45241 and is currently estimated at $410,007, approximately $197 per square foot. 7988 Dimmick Rd is a home located in Butler County with nearby schools including Adena Elementary School, Lakota Ridge Junior School, and Lakota West High School.
Ownership History
Date
Name
Owned For
Owner Type
Purchase Details
Closed on
Aug 26, 2022
Bought by
Eveland Larry T and Eveland Joyce A
Current Estimated Value
Purchase Details
Closed on
Sep 3, 1999
Sold by
Templin David P and Templin Debra A
Bought by
Eveland Larry T and Eveland Joyce A
Home Financials for this Owner
Home Financials are based on the most recent Mortgage that was taken out on this home.
Original Mortgage
$10,000
Interest Rate
7.9%
Mortgage Type
Credit Line Revolving
Purchase Details
Closed on
Mar 24, 1997
Sold by
Templin Eula
Bought by
Templin David P and Templin Debra
Home Financials for this Owner
Home Financials are based on the most recent Mortgage that was taken out on this home.
Original Mortgage
$80,200
Interest Rate
7.82%
Mortgage Type
New Conventional
Create a Home Valuation Report for This Property
The Home Valuation Report is an in-depth analysis detailing your home's value as well as a comparison with similar homes in the area
Home Values in the Area
Average Home Value in this Area
Purchase History
| Date | Buyer | Sale Price | Title Company |
|---|---|---|---|
| Eveland Larry T | -- | -- | |
| Eveland Larry T | $115,000 | Tri-Star Title Agency Inc | |
| Templin David P | $120,000 | -- |
Source: Public Records
Mortgage History
| Date | Status | Borrower | Loan Amount |
|---|---|---|---|
| Open | Eveland Larry T | $50,000 | |
| Previous Owner | Eveland Larry T | $20,000 | |
| Previous Owner | Eveland Larry T | $60,000 | |
| Previous Owner | Eveland Larry T | $63,500 | |
| Previous Owner | Eveland Larry T | $20,000 | |
| Previous Owner | Eveland Larry T | $66,500 | |
| Previous Owner | Eveland Larry T | $10,000 | |
| Previous Owner | Eveland Larry T | $70,000 | |
| Previous Owner | Templin David P | $80,200 |
Source: Public Records
Tax History Compared to Growth
Tax History
| Year | Tax Paid | Tax Assessment Tax Assessment Total Assessment is a certain percentage of the fair market value that is determined by local assessors to be the total taxable value of land and additions on the property. | Land | Improvement |
|---|---|---|---|---|
| 2024 | $4,848 | $114,630 | $25,640 | $88,990 |
| 2023 | $4,813 | $114,580 | $25,640 | $88,940 |
| 2022 | $4,674 | $82,770 | $25,640 | $57,130 |
| 2021 | $4,326 | $80,050 | $25,640 | $54,410 |
| 2020 | $4,429 | $80,050 | $25,640 | $54,410 |
| 2019 | $5,982 | $62,420 | $22,540 | $39,880 |
| 2018 | $3,629 | $62,420 | $22,540 | $39,880 |
| 2017 | $3,694 | $62,420 | $22,540 | $39,880 |
| 2016 | $3,729 | $59,340 | $22,540 | $36,800 |
| 2015 | $3,722 | $59,340 | $22,540 | $36,800 |
| 2014 | $4,104 | $59,340 | $22,540 | $36,800 |
| 2013 | $4,104 | $63,580 | $14,700 | $48,880 |
Source: Public Records
Map
Nearby Homes
- 9616 Holly Leaf Cir
- 7971 Jasmine Trail
- 8178 Stone Dr
- 8141 Stone Dr
- 7879 Hickory Hill Ln
- 7950 Ruth Ct
- 8391 Dimmick Rd
- 9509 Butler Warren Rd
- 8830 Butler Warren Rd
- 8820 Butler Warren Rd
- 9302 W Meadow Dr
- 9337 Cincinnati Columbus Rd
- 9712 Lupine Dr
- 7199 Fieldstone Ct
- 9052 Saxton Dr
- 7761 Jonathan Ct
- 9609 Cedar Knoll Dr
- 8606 Charleston Valley Dr
- 6712 Hummingbird Dr
- 8655 Charleston Creek Dr
- 7972 Dimmick Rd
- 8006 Dimmick Rd
- 9570 Iris Dr
- 9569 Ambleside Dr
- 8022 Dimmick Rd
- 9562 Iris Dr
- 9612 Iris Dr
- 7999 Dimmick Rd
- 7958 Dimmick Rd
- 8011 Dimmick Rd
- 9559 Ambleside Dr
- 9552 Iris Dr
- 9571 Iris Dr
- 8021 Dimmick Rd
- 9626 Iris Dr
- 7946 Dimmick Rd
- 9549 Ambleside Dr
- 7951 Christine Ave
- 8044 Dimmick Rd
- 8033 Dimmick Rd