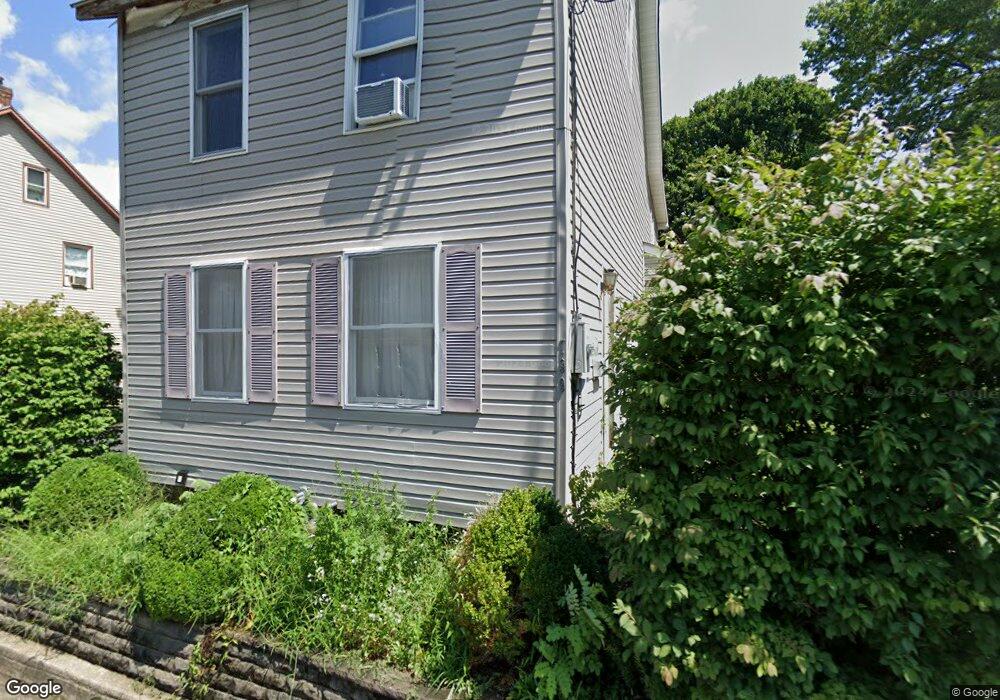
799 Culkin St Phillipsburg, NJ 08865
Estimated Value: $293,094 - $355,000
--
Bed
--
Bath
1,420
Sq Ft
$224/Sq Ft
Est. Value
About This Home
This home is located at 799 Culkin St, Phillipsburg, NJ 08865 and is currently estimated at $317,774, approximately $223 per square foot. 799 Culkin St is a home located in Warren County with nearby schools including Phillipsburg High School, Easton Arts Academy Elementary Cs, and Sts. Philip & James School.
Ownership History
Date
Name
Owned For
Owner Type
Purchase Details
Closed on
Jun 26, 1998
Sold by
Ocwen Federal Bank Fsb
Bought by
Bryant Ralph P
Current Estimated Value
Home Financials for this Owner
Home Financials are based on the most recent Mortgage that was taken out on this home.
Original Mortgage
$47,750
Interest Rate
6.89%
Mortgage Type
FHA
Purchase Details
Closed on
Dec 23, 1997
Sold by
Connell Eugene Allen and Connell Eugene A
Bought by
Ocwen Federal Bank Fsb
Create a Home Valuation Report for This Property
The Home Valuation Report is an in-depth analysis detailing your home's value as well as a comparison with similar homes in the area
Home Values in the Area
Average Home Value in this Area
Purchase History
| Date | Buyer | Sale Price | Title Company |
|---|---|---|---|
| Bryant Ralph P | $47,300 | -- | |
| Ocwen Federal Bank Fsb | -- | -- |
Source: Public Records
Mortgage History
| Date | Status | Borrower | Loan Amount |
|---|---|---|---|
| Previous Owner | Bryant Ralph P | $47,750 |
Source: Public Records
Tax History Compared to Growth
Tax History
| Year | Tax Paid | Tax Assessment Tax Assessment Total Assessment is a certain percentage of the fair market value that is determined by local assessors to be the total taxable value of land and additions on the property. | Land | Improvement |
|---|---|---|---|---|
| 2025 | $6,713 | $147,700 | $40,600 | $107,100 |
| 2024 | $6,197 | $147,700 | $40,600 | $107,100 |
| 2023 | $6,127 | $147,700 | $40,600 | $107,100 |
| 2022 | $6,127 | $147,700 | $40,600 | $107,100 |
| 2021 | $5,930 | $147,700 | $40,600 | $107,100 |
| 2020 | $5,970 | $147,700 | $40,600 | $107,100 |
| 2019 | $5,880 | $147,700 | $40,600 | $107,100 |
| 2018 | $5,880 | $147,700 | $40,600 | $107,100 |
| 2017 | $5,853 | $147,700 | $40,600 | $107,100 |
| 2016 | $5,763 | $147,700 | $40,600 | $107,100 |
| 2015 | $5,719 | $147,700 | $40,600 | $107,100 |
| 2014 | $5,533 | $147,700 | $40,600 | $107,100 |
Source: Public Records
Map
Nearby Homes