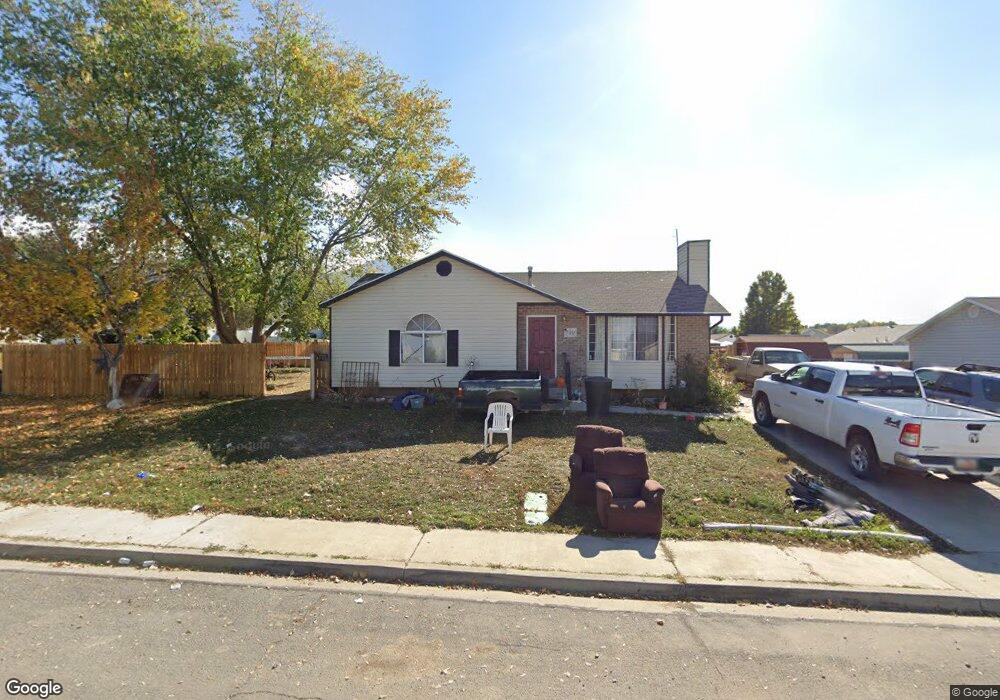
799 W 1150 S Payson, UT 84651
Estimated Value: $419,633 - $442,000
2
Beds
1
Bath
2,119
Sq Ft
$202/Sq Ft
Est. Value
About This Home
This home is located at 799 W 1150 S, Payson, UT 84651 and is currently estimated at $427,908, approximately $201 per square foot. 799 W 1150 S is a home with nearby schools including Wilson Elementary School, Mt. Nebo Junior High School, and Mt. Nebo Middle.
Ownership History
Date
Name
Owned For
Owner Type
Purchase Details
Closed on
Apr 1, 2014
Sold by
Patrick Robin Michelle and Stepp Florence Ruth
Bought by
Mckinney Brian and Mckinney Jenifer
Current Estimated Value
Purchase Details
Closed on
Aug 23, 2002
Sold by
Mendez Jill D
Bought by
Stepp Florence
Home Financials for this Owner
Home Financials are based on the most recent Mortgage that was taken out on this home.
Original Mortgage
$120,145
Interest Rate
6.52%
Purchase Details
Closed on
May 14, 1999
Sold by
Mendez Ari
Bought by
Mendez Jill D
Home Financials for this Owner
Home Financials are based on the most recent Mortgage that was taken out on this home.
Original Mortgage
$123,400
Interest Rate
6.94%
Purchase Details
Closed on
Aug 6, 1996
Sold by
Spillman Thomas J and Spillman Holly A
Bought by
Hale Phillip Lin and Hale Kristen Marie Pugsley
Home Financials for this Owner
Home Financials are based on the most recent Mortgage that was taken out on this home.
Original Mortgage
$107,362
Interest Rate
8.33%
Mortgage Type
FHA
Create a Home Valuation Report for This Property
The Home Valuation Report is an in-depth analysis detailing your home's value as well as a comparison with similar homes in the area
Home Values in the Area
Average Home Value in this Area
Purchase History
| Date | Buyer | Sale Price | Title Company |
|---|---|---|---|
| Mckinney Brian | -- | None Available | |
| Stepp Florence | -- | Backman Stewart Title Servi | |
| Mendez Jill D | -- | Inwest Title Services Inc | |
| Mendez Ari | -- | Inwest Title Services Inc | |
| Hale Phillip Lin | -- | -- |
Source: Public Records
Mortgage History
| Date | Status | Borrower | Loan Amount |
|---|---|---|---|
| Previous Owner | Stepp Florence | $120,145 | |
| Previous Owner | Mendez Ari | $123,400 | |
| Previous Owner | Hale Phillip Lin | $107,362 | |
| Closed | Mendez Ari | $1,495 | |
| Closed | Mckinney Brian | $0 |
Source: Public Records
Tax History Compared to Growth
Tax History
| Year | Tax Paid | Tax Assessment Tax Assessment Total Assessment is a certain percentage of the fair market value that is determined by local assessors to be the total taxable value of land and additions on the property. | Land | Improvement |
|---|---|---|---|---|
| 2025 | $1,981 | $208,670 | $155,300 | $224,100 |
| 2024 | $1,981 | $201,575 | $0 | $0 |
| 2023 | $2,026 | $206,800 | $0 | $0 |
| 2022 | $1,987 | $199,485 | $0 | $0 |
| 2021 | $1,668 | $268,600 | $102,000 | $166,600 |
| 2020 | $1,554 | $244,700 | $88,700 | $156,000 |
| 2019 | $1,394 | $225,100 | $88,700 | $136,400 |
| 2018 | $1,319 | $205,200 | $68,800 | $136,400 |
| 2017 | $1,199 | $100,320 | $0 | $0 |
| 2016 | $1,093 | $90,915 | $0 | $0 |
| 2015 | $1,022 | $84,370 | $0 | $0 |
| 2014 | $946 | $78,650 | $0 | $0 |
Source: Public Records
Map
Nearby Homes
- 1163 S 730 W
- 1087 S 680 W
- 1172 S 880 W
- 1161 Utah 198
- 802 Brookside Ct
- 1128 W 1150 S Unit 9
- 1116 W 1290 S
- 1216 S 1150 W Unit 19
- 588 W 1450 S
- 1002 W Temple Rim Ln
- 1192 W 1130 St S Unit 202
- 598 W Saddlebrook Dr
- 626 S 800 W Unit 32
- 1579 S 910 W
- 610 S 800 W Unit 30
- 1592 S 790 W
- 513 W 600 S
- 533 S 700 W
- 1597 S 1100 W
- 528 S 800 W