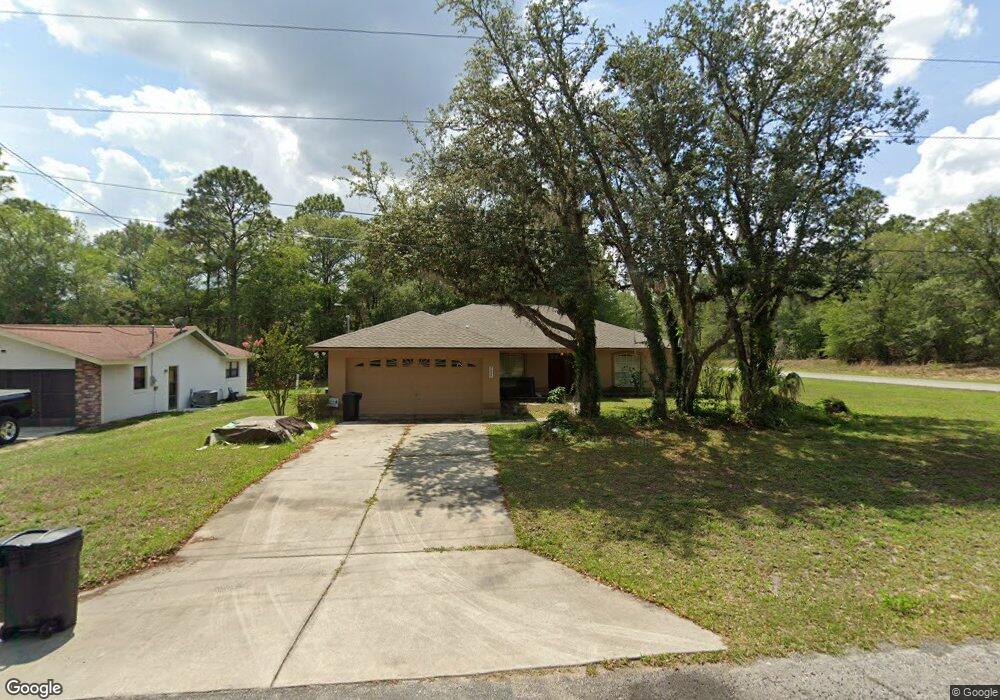
7990 N Gibralter Dr Citrus Springs, FL 34434
Estimated Value: $282,000 - $319,000
4
Beds
2
Baths
1,831
Sq Ft
$164/Sq Ft
Est. Value
About This Home
This home is located at 7990 N Gibralter Dr, Citrus Springs, FL 34434 and is currently estimated at $299,620, approximately $163 per square foot. 7990 N Gibralter Dr is a home located in Citrus County with nearby schools including Citrus Springs Elementary School, Citrus Springs Middle School, and Lecanto High School.
Ownership History
Date
Name
Owned For
Owner Type
Purchase Details
Closed on
Jun 20, 2016
Sold by
Cook Theresa M
Bought by
Marshall Leslie S
Current Estimated Value
Purchase Details
Closed on
Dec 27, 2011
Sold by
Cook Gilbert W and Cook Theresa M
Bought by
Cyr Leslie S and Cook Gilbert W
Purchase Details
Closed on
Dec 3, 2004
Sold by
Pav Peter A and Peter A Pav Trust
Bought by
Cook Gilbert W and Cook Theresa M
Home Financials for this Owner
Home Financials are based on the most recent Mortgage that was taken out on this home.
Original Mortgage
$97,400
Interest Rate
5.57%
Mortgage Type
Purchase Money Mortgage
Purchase Details
Closed on
May 14, 2004
Sold by
Ahn Charles A
Bought by
Pav Peter A and Peter A Pav Trust
Purchase Details
Closed on
Jul 9, 2002
Sold by
Habitat For Humanity Of Citrus Cnty Inc
Bought by
Ahn Charles A
Purchase Details
Closed on
Dec 1, 1995
Bought by
Cyr Leslie S and Marshall Leslie S
Create a Home Valuation Report for This Property
The Home Valuation Report is an in-depth analysis detailing your home's value as well as a comparison with similar homes in the area
Home Values in the Area
Average Home Value in this Area
Purchase History
| Date | Buyer | Sale Price | Title Company |
|---|---|---|---|
| Marshall Leslie S | $77,000 | None Available | |
| Cyr Leslie S | $28,857 | None Available | |
| Cook Gilbert W | $121,800 | Dba Crystal River Title | |
| Pav Peter A | $3,500 | Dba Crystal River Title | |
| Ahn Charles A | $1,300 | Crystal River Title | |
| Cyr Leslie S | $100 | -- |
Source: Public Records
Mortgage History
| Date | Status | Borrower | Loan Amount |
|---|---|---|---|
| Previous Owner | Cook Gilbert W | $97,400 |
Source: Public Records
Tax History Compared to Growth
Tax History
| Year | Tax Paid | Tax Assessment Tax Assessment Total Assessment is a certain percentage of the fair market value that is determined by local assessors to be the total taxable value of land and additions on the property. | Land | Improvement |
|---|---|---|---|---|
| 2024 | $3,361 | $231,813 | $9,770 | $222,043 |
| 2023 | $3,361 | $232,390 | $8,450 | $223,940 |
| 2022 | $2,936 | $203,867 | $5,280 | $198,587 |
| 2021 | $2,546 | $164,454 | $3,250 | $161,204 |
| 2020 | $2,411 | $156,311 | $3,420 | $152,891 |
| 2019 | $2,258 | $144,429 | $3,120 | $141,309 |
| 2018 | $2,111 | $133,062 | $3,120 | $129,942 |
| 2017 | $1,974 | $121,240 | $2,780 | $118,460 |
| 2016 | $1,597 | $93,122 | $2,810 | $90,312 |
| 2015 | $757 | $79,056 | $2,530 | $76,526 |
| 2014 | $766 | $78,429 | $2,601 | $75,828 |
Source: Public Records
Map
Nearby Homes
- 7958 N Oberon Terrace
- 8032 N Oberon Terrace
- 8050 N Oberon Terrace
- 7962 N Hale Rd
- 7852 N Hale Rd
- 8009 N Primrose Dr
- 8001 N Galena Ave
- 7802 N Galena Ave
- 7578 N Galena Ave
- 8134 N Galena Ave
- 7722 N Galena Ave
- 7970 N Galena Ave
- 8150 N Galena Ave
- 7814 N Galena Ave
- 7991 N Tiny Lily Dr
- 7192 N Gibralter Dr
- 7229 N Gibralter Dr
- 8244 N Galena Ave
- 7548 N Primrose Dr
- 7578 N Primrose Dr
- 7974 N Gibralter Dr
- 7960 N Gibralter Dr
- 7972 N Oberon Terrace
- 7909 N Oberon Terrace
- 8068 N Oberon Terrace
- 7942 N Oberon Terrace
- 7979 N Hale Rd
- 7924 N Oberon Terrace
- 7961 N Hale Rd
- 7885 N Valhalla Dr
- 7916 N Hale Rd
- 7993 N Hale Rd
- 7929 N Hale Rd
- 8188 N Hale Rd
- 7868 N Hale Rd
- 7998 N Hale Rd
- 8105 N Hale Rd
- 7840 N Gibralter Dr
- 8058 N Hale Rd
- 8121 N Hale Rd