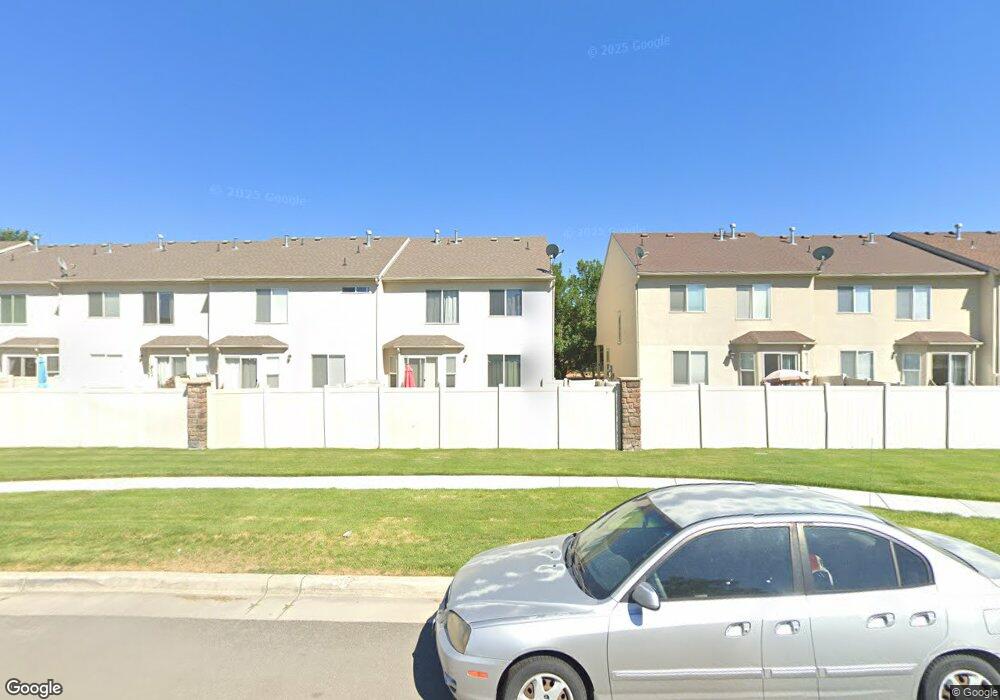
7992 S Lismore Ln West Jordan, UT 84088
Estimated Value: $381,000 - $441,000
2
Beds
3
Baths
2,058
Sq Ft
$204/Sq Ft
Est. Value
About This Home
This home is located at 7992 S Lismore Ln, West Jordan, UT 84088 and is currently estimated at $420,387, approximately $204 per square foot. 7992 S Lismore Ln is a home located in Salt Lake County with nearby schools including Columbia Elementary School, Joel P. Jensen Middle School, and West Jordan High School.
Ownership History
Date
Name
Owned For
Owner Type
Purchase Details
Closed on
Sep 29, 2008
Sold by
Birdsley Robert W and Birdsley Carolyn R
Bought by
Forst John M and Forst Tracy
Current Estimated Value
Home Financials for this Owner
Home Financials are based on the most recent Mortgage that was taken out on this home.
Original Mortgage
$164,000
Outstanding Balance
$109,370
Interest Rate
6.49%
Mortgage Type
Unknown
Estimated Equity
$311,017
Purchase Details
Closed on
May 17, 2006
Sold by
Hixenbaugh Sarah J
Bought by
Birdsley Robert W and Birdsley Carolyn R
Home Financials for this Owner
Home Financials are based on the most recent Mortgage that was taken out on this home.
Original Mortgage
$148,000
Interest Rate
6.41%
Mortgage Type
Fannie Mae Freddie Mac
Purchase Details
Closed on
Jun 9, 2003
Sold by
Lismore Llc
Bought by
Hixenbaugh Sarah J
Home Financials for this Owner
Home Financials are based on the most recent Mortgage that was taken out on this home.
Original Mortgage
$159,783
Interest Rate
5.25%
Mortgage Type
Unknown
Create a Home Valuation Report for This Property
The Home Valuation Report is an in-depth analysis detailing your home's value as well as a comparison with similar homes in the area
Home Values in the Area
Average Home Value in this Area
Purchase History
| Date | Buyer | Sale Price | Title Company |
|---|---|---|---|
| Forst John M | -- | Landmark Title | |
| Birdsley Robert W | -- | Us Title Of Utah | |
| Hixenbaugh Sarah J | -- | Us Title Of Utah |
Source: Public Records
Mortgage History
| Date | Status | Borrower | Loan Amount |
|---|---|---|---|
| Open | Forst John M | $164,000 | |
| Previous Owner | Birdsley Robert W | $148,000 | |
| Previous Owner | Hixenbaugh Sarah J | $159,783 |
Source: Public Records
Tax History Compared to Growth
Tax History
| Year | Tax Paid | Tax Assessment Tax Assessment Total Assessment is a certain percentage of the fair market value that is determined by local assessors to be the total taxable value of land and additions on the property. | Land | Improvement |
|---|---|---|---|---|
| 2025 | $2,057 | $407,600 | $72,700 | $334,900 |
| 2024 | $2,057 | $395,700 | $70,300 | $325,400 |
| 2023 | $2,057 | $370,200 | $66,300 | $303,900 |
| 2022 | $2,117 | $377,600 | $65,000 | $312,600 |
| 2021 | $1,764 | $286,400 | $48,800 | $237,600 |
| 2020 | $1,547 | $235,800 | $48,800 | $187,000 |
| 2019 | $1,552 | $232,000 | $48,800 | $183,200 |
| 2018 | $1,433 | $212,400 | $47,000 | $165,400 |
| 2017 | $1,361 | $200,800 | $47,000 | $153,800 |
| 2016 | $1,354 | $187,800 | $56,700 | $131,100 |
| 2015 | $1,338 | $180,900 | $57,800 | $123,100 |
| 2014 | $1,284 | $170,900 | $55,100 | $115,800 |
Source: Public Records
Map
Nearby Homes
- 3332 Lower Newark Way
- 8058 S Lismore Ln Unit 304
- 3476 W Spaulding Rd
- 8180 S Old Bingham Hwy
- 3546 W 7980 S
- 3354 W 7800 S
- 3066 W Linton Dr
- 3165 W 7720 S
- 3422 Briar Dr
- 3629 W 7825 S
- 3647 W 7865 S
- 7987 S 2980 W
- 7611 S Springbrook Dr
- 7989 S 3725 W
- 7991 S 3725 W
- 3112 Green Acre Dr
- 7604 S Autumn Dr
- 7942 S 2800 W
- 8407 Meadow Green Way
- 7721 Sunset Cir
- 7992 Lismore Ln
- 7988 Lismore Ln
- 7996 Lismore Ln
- 7996 S Lismore Ln
- 7986 Lismore Ln
- 7986 S Lismore Ln
- 8002 S Lismore Ln
- 8002 Lismore Ln
- 7982 Lismore Ln
- 7982 Lismore Ln Unit 154
- 8004 S Lismore Ln
- 8004 Lismore Ln
- 7978 Lismore Ln
- 7978 Lismore Ln Unit 155
- 7978 S Lismore Ln
- 8008 Lismore Ln
- 8012 Lismore Ln
- 8012 Lismore Ln Unit 146
- 8012 S Lismore Ln
- 3322 Lower Huntly Way