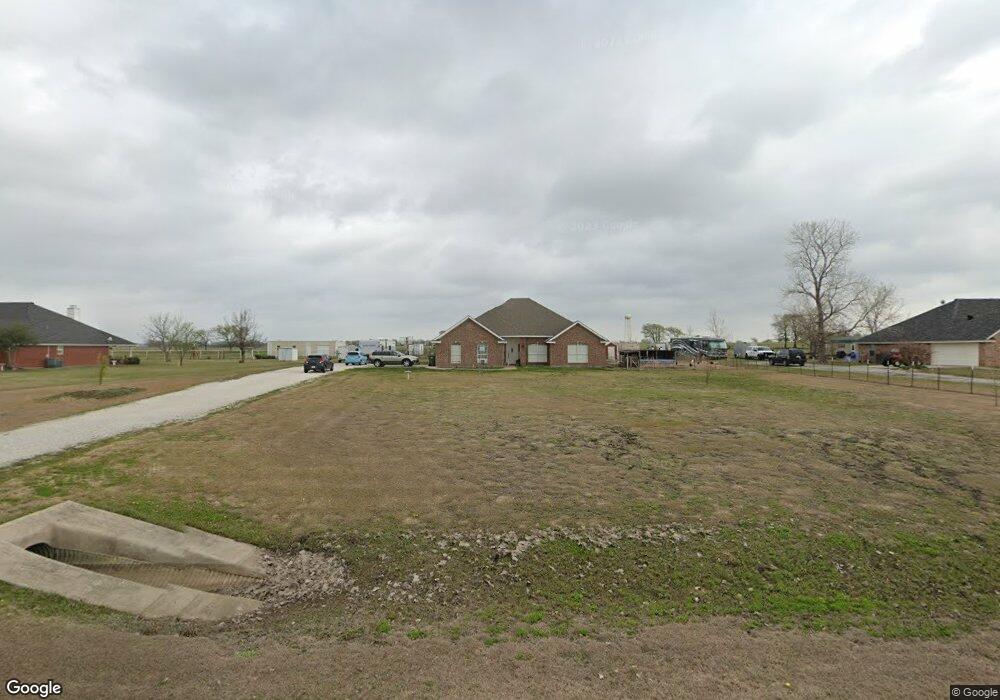
7995 Country View Ln Sanger, TX 76266
Estimated Value: $492,606 - $539,000
4
Beds
2
Baths
1,926
Sq Ft
$267/Sq Ft
Est. Value
About This Home
This home is located at 7995 Country View Ln, Sanger, TX 76266 and is currently estimated at $514,402, approximately $267 per square foot. 7995 Country View Ln is a home located in Denton County with nearby schools including Chisholm Trail Elementary School, Clear Creek Intermediate School, and Sanger Sixth Grade Campus.
Ownership History
Date
Name
Owned For
Owner Type
Purchase Details
Closed on
Sep 23, 2016
Sold by
Pearman Jody D and Pearman Amy
Bought by
Walters David
Current Estimated Value
Home Financials for this Owner
Home Financials are based on the most recent Mortgage that was taken out on this home.
Original Mortgage
$200,001
Outstanding Balance
$159,856
Interest Rate
3.45%
Mortgage Type
New Conventional
Estimated Equity
$354,546
Purchase Details
Closed on
Dec 26, 2001
Sold by
Morgan Gary D and Morgan Jacqueline J
Bought by
Pearman Jody D and Pearman Amy
Home Financials for this Owner
Home Financials are based on the most recent Mortgage that was taken out on this home.
Original Mortgage
$77,000
Interest Rate
6.73%
Purchase Details
Closed on
Mar 12, 2001
Sold by
Looper Enterprises Inc
Bought by
Morgan Gary D and Morgan Jacqueline J
Home Financials for this Owner
Home Financials are based on the most recent Mortgage that was taken out on this home.
Original Mortgage
$125,250
Interest Rate
7.1%
Mortgage Type
Purchase Money Mortgage
Create a Home Valuation Report for This Property
The Home Valuation Report is an in-depth analysis detailing your home's value as well as a comparison with similar homes in the area
Home Values in the Area
Average Home Value in this Area
Purchase History
| Date | Buyer | Sale Price | Title Company |
|---|---|---|---|
| Walters David | -- | Title Resources | |
| Pearman Jody D | -- | -- | |
| Morgan Gary D | -- | -- |
Source: Public Records
Mortgage History
| Date | Status | Borrower | Loan Amount |
|---|---|---|---|
| Open | Walters David | $200,001 | |
| Previous Owner | Pearman Jody D | $77,000 | |
| Previous Owner | Morgan Gary D | $125,250 |
Source: Public Records
Tax History Compared to Growth
Tax History
| Year | Tax Paid | Tax Assessment Tax Assessment Total Assessment is a certain percentage of the fair market value that is determined by local assessors to be the total taxable value of land and additions on the property. | Land | Improvement |
|---|---|---|---|---|
| 2025 | $4,713 | $475,420 | $104,544 | $411,094 |
| 2024 | $5,866 | $432,200 | $0 | $0 |
| 2023 | $4,206 | $392,909 | $104,544 | $360,076 |
| 2022 | $5,925 | $357,190 | $78,408 | $305,976 |
| 2021 | $4,738 | $324,718 | $78,408 | $246,310 |
| 2020 | $4,864 | $309,567 | $78,408 | $236,521 |
| 2019 | $4,606 | $281,425 | $78,408 | $236,521 |
| 2018 | $4,219 | $255,841 | $56,628 | $199,213 |
| 2017 | $4,283 | $257,918 | $56,628 | $201,290 |
| 2016 | $3,356 | $202,140 | $41,818 | $160,322 |
| 2015 | $2,823 | $196,586 | $41,818 | $154,768 |
| 2014 | $2,823 | $179,812 | $41,818 | $137,994 |
| 2013 | -- | $175,544 | $41,818 | $133,726 |
Source: Public Records
Map
Nearby Homes
- TBD Cashs Mill Rd
- 000 Fm 2450
- 9715 Fm 2450
- 13709 Cash Mill Rd
- 13721 Cash Mill Rd
- 11087 Chisum Rd
- 13743 Cashs Mill
- 59.66 Rd
- 7240 Hunnington Dr
- 14134 Cashs Mill Rd
- 90.54 + Unit ACRES 14134 Cashs
- 6810 Hunnington Dr
- 8623 Chisum Rd
- 12142 Fm 2450
- 2435 County Road 247
- 9494 Waide Rd
- 10902 Clear Creek Rd W
- 11007 Farm To Market Road 2450
- 6362 Belz Rd
- 6298 Belz Rd
- 8025 Country View Ln
- 7953 Country View Ln
- 8055 Country View Ln
- XXXX Country View Ln
- 7956 Country View Ln
- 8024 Country View Ln
- 8087 Country View Ln
- 8054 Country View Ln
- 7924 Country View Ln
- 8086 Country View Ln
- 7901 Country View Ln
- 8115 Country View Ln
- 8114 Country View Ln
- 7878 Country View Ln
- 8143 Country View Ln
- 7855 Country View Ln
- 8142 Country View Ln
- 7854 Country View Ln
- 8173 Country View Ln
- 7823 Country View Ln