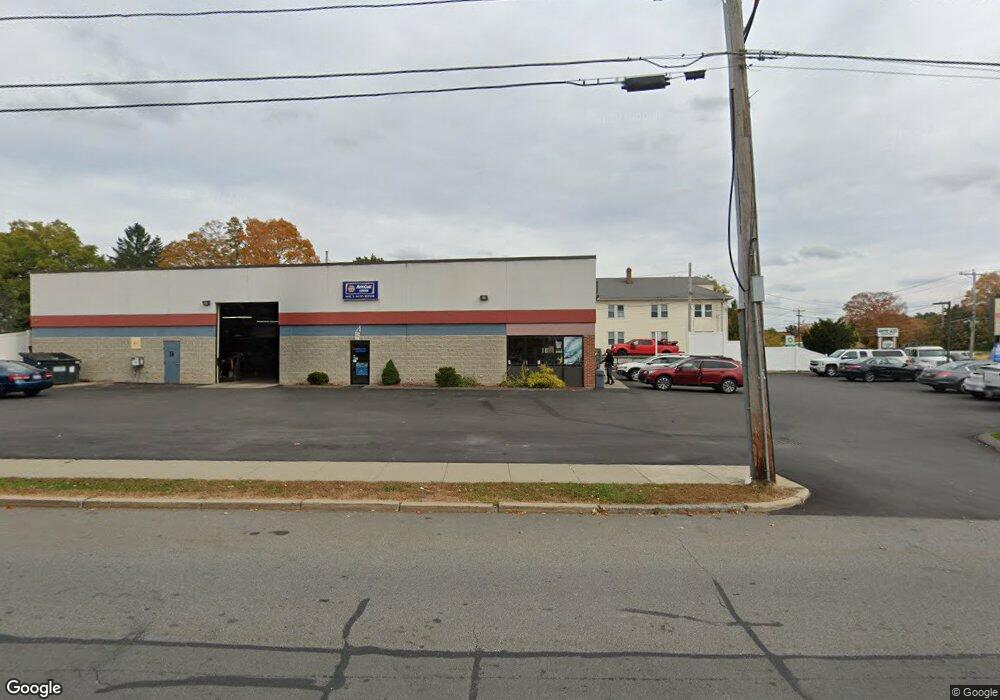
79R E Main St Webster, MA 01570
Estimated Value: $355,000 - $857,713
Studio
2
Baths
--
Sq Ft
25,831
Sq Ft Lot
About This Home
This home is located at 79R E Main St, Webster, MA 01570 and is currently estimated at $633,571. 79R E Main St is a home located in Worcester County with nearby schools including Park Avenue Elementary School, Webster Middle School, and Bartlett High School.
Ownership History
Date
Name
Owned For
Owner Type
Purchase Details
Closed on
Nov 15, 2010
Sold by
Sochacka Stanislawa A and Sochacki Piotr
Bought by
Sochacki Piotr
Current Estimated Value
Purchase Details
Closed on
Jan 15, 2002
Sold by
Kiritsis Irene and Bandouveres Magdalene
Bought by
Sochacka Stanislawa A and Sochacki Piotr
Home Financials for this Owner
Home Financials are based on the most recent Mortgage that was taken out on this home.
Original Mortgage
$150,000
Interest Rate
7.04%
Mortgage Type
Purchase Money Mortgage
Create a Home Valuation Report for This Property
The Home Valuation Report is an in-depth analysis detailing your home's value as well as a comparison with similar homes in the area
Home Values in the Area
Average Home Value in this Area
Purchase History
| Date | Buyer | Sale Price | Title Company |
|---|---|---|---|
| Sochacki Piotr | -- | -- | |
| Sochacka Stanislawa A | $190,000 | -- |
Source: Public Records
Mortgage History
| Date | Status | Borrower | Loan Amount |
|---|---|---|---|
| Previous Owner | Sochacka Stanislawa A | $140,000 | |
| Previous Owner | Sochacka Stanislawa A | $150,000 |
Source: Public Records
Tax History
| Year | Tax Paid | Tax Assessment Tax Assessment Total Assessment is a certain percentage of the fair market value that is determined by local assessors to be the total taxable value of land and additions on the property. | Land | Improvement |
|---|---|---|---|---|
| 2025 | $10,105 | $850,600 | $41,300 | $809,300 |
| 2024 | $9,930 | $815,300 | $39,700 | $775,600 |
| 2023 | $8,896 | $711,700 | $37,800 | $673,900 |
| 2022 | $8,661 | $620,400 | $36,700 | $583,700 |
| 2021 | $8,373 | $554,500 | $36,700 | $517,800 |
| 2020 | $8,266 | $548,900 | $36,700 | $512,200 |
| 2019 | $7,956 | $519,000 | $36,700 | $482,300 |
| 2018 | $7,484 | $486,300 | $36,700 | $449,600 |
| 2017 | $6,834 | $451,700 | $38,800 | $412,900 |
| 2016 | $6,512 | $430,100 | $38,800 | $391,300 |
| 2015 | $6,235 | $424,700 | $38,000 | $386,700 |
Source: Public Records
Map
Nearby Homes
Your Personal Tour Guide
Ask me questions while you tour the home.