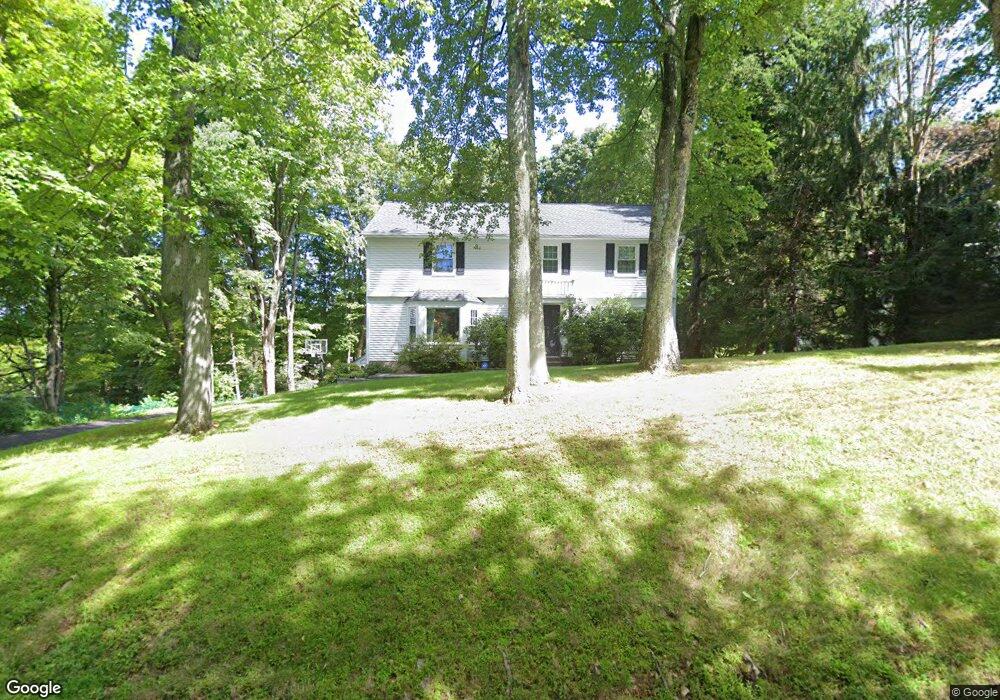
7A Main St Randolph, NJ 07869
Estimated Value: $698,936 - $786,000
Studio
--
Bath
2,306
Sq Ft
$324/Sq Ft
Est. Value
About This Home
This home is located at 7A Main St, Randolph, NJ 07869 and is currently estimated at $746,484, approximately $323 per square foot. 7A Main St is a home with nearby schools including Randolph High School, Randolph Middle School, and Gottesman RTW Academy.
Ownership History
Date
Name
Owned For
Owner Type
Purchase Details
Closed on
Aug 17, 2017
Sold by
Deperna James J and Deperna Melissa J
Bought by
Rowland Richard C and Rowland Nicole Lemon
Current Estimated Value
Home Financials for this Owner
Home Financials are based on the most recent Mortgage that was taken out on this home.
Original Mortgage
$424,000
Outstanding Balance
$354,461
Interest Rate
4.03%
Mortgage Type
New Conventional
Estimated Equity
$392,023
Purchase Details
Closed on
Jan 23, 1996
Sold by
Purvis Janet H
Bought by
Deperna James J and Mansfield Melissa J
Create a Home Valuation Report for This Property
The Home Valuation Report is an in-depth analysis detailing your home's value as well as a comparison with similar homes in the area
Home Values in the Area
Average Home Value in this Area
Purchase History
| Date | Buyer | Sale Price | Title Company |
|---|---|---|---|
| Rowland Richard C | $455,000 | None Available | |
| Deperna James J | $244,000 | -- |
Source: Public Records
Mortgage History
| Date | Status | Borrower | Loan Amount |
|---|---|---|---|
| Open | Rowland Richard C | $424,000 |
Source: Public Records
Tax History
| Year | Tax Paid | Tax Assessment Tax Assessment Total Assessment is a certain percentage of the fair market value that is determined by local assessors to be the total taxable value of land and additions on the property. | Land | Improvement |
|---|---|---|---|---|
| 2025 | $12,080 | $426,700 | $146,100 | $280,600 |
| 2024 | $11,777 | $426,700 | $146,100 | $280,600 |
Source: Public Records
Map
Nearby Homes
Your Personal Tour Guide
Ask me questions while you tour the home.