7E Toms Path Dennis Port, MA 02639
Dennis Port NeighborhoodEstimated Value: $451,000 - $495,000
2
Beds
1
Bath
672
Sq Ft
$708/Sq Ft
Est. Value
About This Home
This home is located at 7E Toms Path, Dennis Port, MA 02639 and is currently estimated at $475,499, approximately $707 per square foot. 7E Toms Path is a home located in Barnstable County with nearby schools including Dennis-Yarmouth Regional High School and St. Pius X. School.
Ownership History
Date
Name
Owned For
Owner Type
Purchase Details
Closed on
Dec 22, 2023
Sold by
Ferrick Ft and Ferrick
Bought by
Leininger Wendy L
Current Estimated Value
Home Financials for this Owner
Home Financials are based on the most recent Mortgage that was taken out on this home.
Original Mortgage
$285,000
Outstanding Balance
$280,269
Interest Rate
7.5%
Mortgage Type
Purchase Money Mortgage
Estimated Equity
$195,230
Purchase Details
Closed on
Oct 11, 2022
Sold by
Ferrick Henry G
Bought by
Ferrick Ft and Ferrick
Purchase Details
Closed on
Jun 18, 1979
Bought by
Ferrick Henry G
Create a Home Valuation Report for This Property
The Home Valuation Report is an in-depth analysis detailing your home's value as well as a comparison with similar homes in the area
Home Values in the Area
Average Home Value in this Area
Purchase History
| Date | Buyer | Sale Price | Title Company |
|---|---|---|---|
| Leininger Wendy L | $380,000 | None Available | |
| Leininger Wendy L | $380,000 | None Available | |
| Leininger Wendy L | $380,000 | None Available | |
| Leininger Wendy L | $380,000 | None Available | |
| Ferrick Ft | -- | None Available | |
| Ferrick Ft | -- | None Available | |
| Ferrick Ft | -- | None Available | |
| Ferrick Ft | -- | None Available | |
| Ferrick Henry G | -- | -- | |
| Ferrick Henry G | -- | -- |
Source: Public Records
Mortgage History
| Date | Status | Borrower | Loan Amount |
|---|---|---|---|
| Open | Leininger Wendy L | $285,000 | |
| Closed | Leininger Wendy L | $285,000 |
Source: Public Records
Tax History Compared to Growth
Tax History
| Year | Tax Paid | Tax Assessment Tax Assessment Total Assessment is a certain percentage of the fair market value that is determined by local assessors to be the total taxable value of land and additions on the property. | Land | Improvement |
|---|---|---|---|---|
| 2025 | $1,662 | $383,900 | $176,500 | $207,400 |
| 2024 | $1,522 | $346,700 | $169,700 | $177,000 |
| 2023 | $1,435 | $315,300 | $154,300 | $161,000 |
| 2022 | $1,456 | $260,000 | $139,000 | $121,000 |
| 2021 | $1,413 | $234,400 | $136,300 | $98,100 |
| 2020 | $1,310 | $214,700 | $125,800 | $88,900 |
| 2019 | $1,247 | $202,100 | $123,300 | $78,800 |
| 2018 | $1,254 | $197,800 | $127,200 | $70,600 |
| 2017 | $1,141 | $185,600 | $117,400 | $68,200 |
| 2016 | $1,175 | $180,000 | $122,300 | $57,700 |
| 2015 | $1,152 | $180,000 | $122,300 | $57,700 |
| 2014 | $1,050 | $165,300 | $107,600 | $57,700 |
Source: Public Records
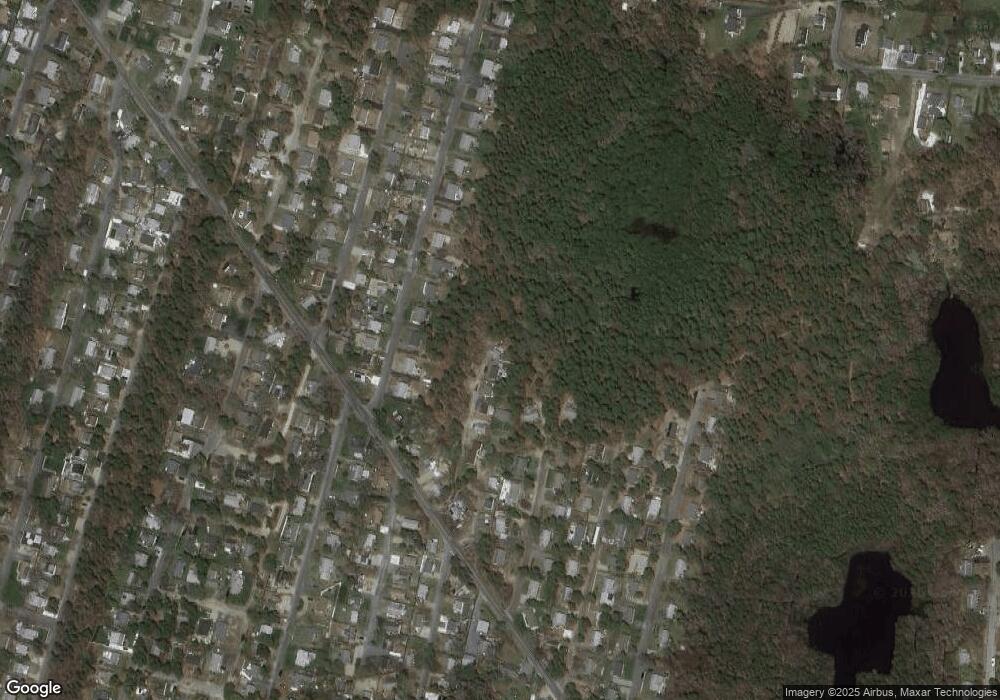
Map
Nearby Homes
- 22 Wixon Rd
- 72 Bassett Ln
- 301 Main St
- 12 The Other Rd
- 102 Cornell Dr
- 7 Ferncliff Rd
- 268 Main St
- 15 Glendon Rd
- 4 Coffey Ln
- 125 Main St Unit 3
- 435 Main St Unit 1
- 71 Main St
- 248 Sea St
- 37 Beach Hills Rd
- 37-A Beach Hills Rd
- 262 Old Wharf Rd Unit 27
- 262 Old Wharf Rd Unit 18
- 262 Old Wharf Rd Unit 67
- 262 Old Wharf Rd Unit 20
- 12 Cross St