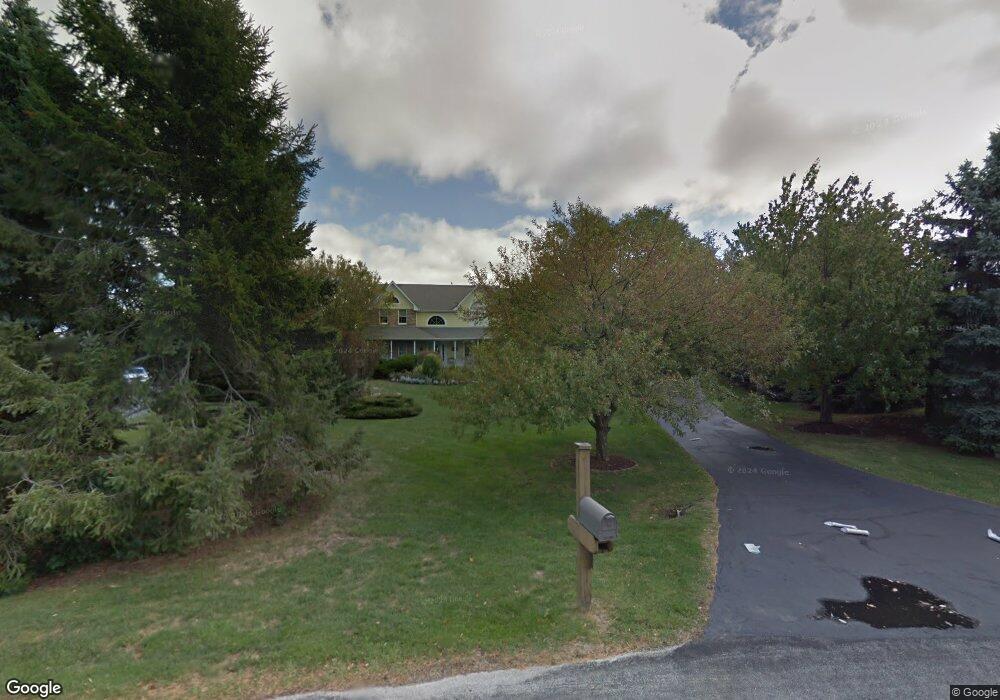
7N085 Canterbury Ct Unit 2 Saint Charles, IL 60175
Estimated Value: $637,647 - $701,000
--
Bed
1
Bath
2,877
Sq Ft
$233/Sq Ft
Est. Value
About This Home
This home is located at 7N085 Canterbury Ct Unit 2, Saint Charles, IL 60175 and is currently estimated at $670,912, approximately $233 per square foot. 7N085 Canterbury Ct Unit 2 is a home located in Kane County with nearby schools including Wasco Elementary School, Thompson Middle School, and St Charles North High School.
Ownership History
Date
Name
Owned For
Owner Type
Purchase Details
Closed on
Nov 19, 2010
Sold by
Griparis John G and Dillon Judith A
Bought by
Griparis Judith A Dillon and The Judith A Dillon Griparis Trust
Current Estimated Value
Purchase Details
Closed on
Sep 16, 1996
Sold by
Stratman John E and Stratman Carolyn B
Bought by
Dillon Judith A
Home Financials for this Owner
Home Financials are based on the most recent Mortgage that was taken out on this home.
Original Mortgage
$206,000
Outstanding Balance
$16,403
Interest Rate
7.37%
Estimated Equity
$654,509
Purchase Details
Closed on
Jun 10, 1996
Sold by
Zorich Bruce M and Zorich Sharon L
Bought by
Phillips David and Phillips Christine
Home Financials for this Owner
Home Financials are based on the most recent Mortgage that was taken out on this home.
Original Mortgage
$270,000
Interest Rate
8.05%
Create a Home Valuation Report for This Property
The Home Valuation Report is an in-depth analysis detailing your home's value as well as a comparison with similar homes in the area
Home Values in the Area
Average Home Value in this Area
Purchase History
| Date | Buyer | Sale Price | Title Company |
|---|---|---|---|
| Griparis Judith A Dillon | -- | None Available | |
| Dillon Judith A | $301,000 | Chicago Title Insurance Co | |
| Phillips David | $300,000 | Advanced Title Services Inc |
Source: Public Records
Mortgage History
| Date | Status | Borrower | Loan Amount |
|---|---|---|---|
| Open | Dillon Judith A | $206,000 | |
| Previous Owner | Phillips David | $270,000 |
Source: Public Records
Tax History Compared to Growth
Tax History
| Year | Tax Paid | Tax Assessment Tax Assessment Total Assessment is a certain percentage of the fair market value that is determined by local assessors to be the total taxable value of land and additions on the property. | Land | Improvement |
|---|---|---|---|---|
| 2024 | $11,067 | $183,441 | $35,106 | $148,335 |
| 2023 | $10,753 | $164,007 | $31,387 | $132,620 |
| 2022 | $10,383 | $149,437 | $28,599 | $120,838 |
| 2021 | $9,735 | $141,098 | $27,003 | $114,095 |
| 2020 | $9,714 | $139,067 | $26,614 | $112,453 |
| 2019 | $9,586 | $137,025 | $26,223 | $110,802 |
| 2018 | $9,572 | $137,025 | $26,223 | $110,802 |
| 2017 | $9,482 | $135,013 | $25,838 | $109,175 |
| 2016 | $10,070 | $131,605 | $25,186 | $106,419 |
| 2015 | -- | $127,970 | $24,490 | $103,480 |
| 2014 | -- | $129,931 | $24,865 | $105,066 |
| 2013 | -- | $132,111 | $25,282 | $106,829 |
Source: Public Records
Map
Nearby Homes
- 7N075 Hastings Dr
- 7N107 Hastings Dr
- 7N072 Willowbrook Dr
- 6N679 Colonel Bennett Ln
- 39W841 Prunetree Ln
- 1857 Chandolin Ln
- 1865 Chandolin Ln
- 1863 Chandolin Ln
- 1867 Chandolin Ln
- 1854 Chandolin Ln
- 1858 Chandolin Ln
- 1850 Diamond Dr
- 3620 Sahara Rd
- 40W630 Winchester Way
- 41W455 Brierwood Dr
- 3591 Sandstone Cir
- 3590 Sandstone Cir
- 1850 Chandolin Ln
- 1846 Chandolin Ln
- 1848 Chandolin Ln
- 7N091 Canterbury Ct
- 7N061 Canterbury Ct
- 7N088 Canterbury Ct
- 7N015 Canterbury Ct Unit 2
- 7N072 Hastings Dr Unit 1
- 7N108 Hastings Dr
- 7N024 Hastings Dr
- 7N070 Canterbury Ct Unit 2
- 7N050 Canterbury Ct
- 6N971 Canterbury Ct Unit 2
- 0n Corron Rd
- 7N004 Canterbury Ct
- Lot 1 Silver Glen Rd
- 40W310 Waterford Ln Unit 1
- 6N984 Canterbury Ct
- 6N973 Hastings Dr
- 6N960 Canterbury Ct
- 6N915 Corron Rd
- 6N931 Hastings Dr
- 6N918 Hastings Dr