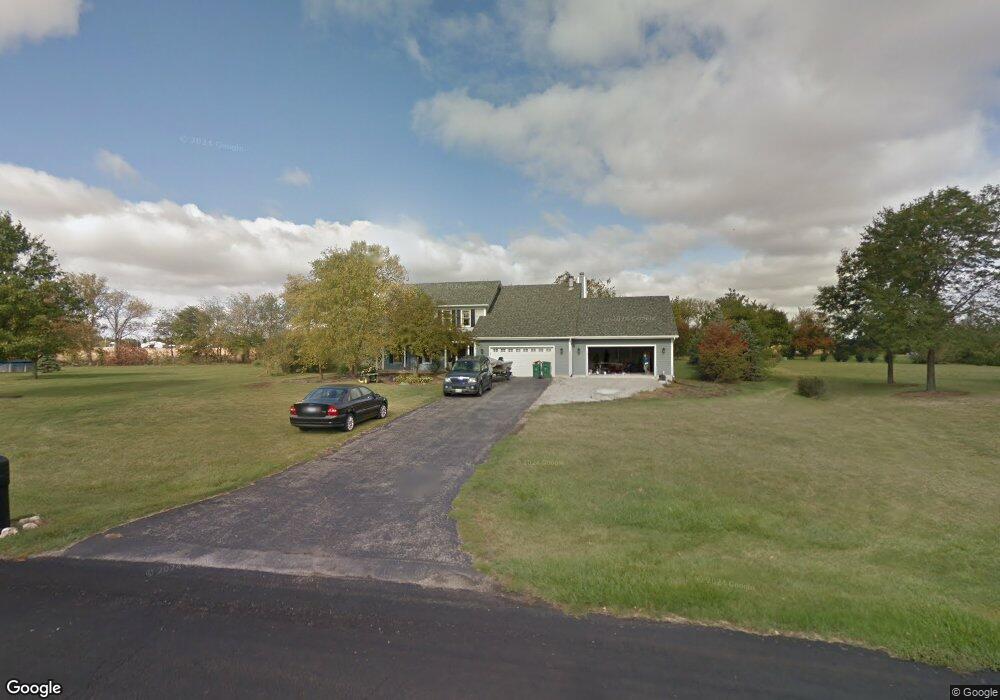
7N281 Fox Bend Dr Saint Charles, IL 60175
Estimated Value: $481,000 - $542,000
--
Bed
1
Bath
2,264
Sq Ft
$224/Sq Ft
Est. Value
About This Home
This home is located at 7N281 Fox Bend Dr, Saint Charles, IL 60175 and is currently estimated at $507,428, approximately $224 per square foot. 7N281 Fox Bend Dr is a home located in Kane County with nearby schools including Wasco Elementary School, Thompson Middle School, and St Charles North High School.
Ownership History
Date
Name
Owned For
Owner Type
Purchase Details
Closed on
Jun 1, 2021
Sold by
Taylor Darlene A and Taylor John D
Bought by
Zappitelli Dawn G and The Dawn G Zappitelli Trust
Current Estimated Value
Purchase Details
Closed on
Oct 10, 2003
Sold by
Taylor John D
Bought by
Taylor Darlene A and Walenta Darlene A
Purchase Details
Closed on
Jun 25, 2002
Sold by
Patel Suryakant A and Patel Reshma J
Bought by
Taylor John D and Walenta Darlene A
Home Financials for this Owner
Home Financials are based on the most recent Mortgage that was taken out on this home.
Original Mortgage
$250,000
Interest Rate
6.79%
Purchase Details
Closed on
Mar 20, 1998
Sold by
Smith Ronald and Smith Kimberly
Bought by
Patel Suryakant A and Patel Reshma J
Home Financials for this Owner
Home Financials are based on the most recent Mortgage that was taken out on this home.
Original Mortgage
$44,250
Interest Rate
7.14%
Create a Home Valuation Report for This Property
The Home Valuation Report is an in-depth analysis detailing your home's value as well as a comparison with similar homes in the area
Home Values in the Area
Average Home Value in this Area
Purchase History
| Date | Buyer | Sale Price | Title Company |
|---|---|---|---|
| Zappitelli Dawn G | $357,000 | First American Title | |
| Taylor Darlene A | -- | -- | |
| Taylor John D | $352,000 | -- | |
| Patel Suryakant A | $59,000 | Ticor Title Insurance |
Source: Public Records
Mortgage History
| Date | Status | Borrower | Loan Amount |
|---|---|---|---|
| Previous Owner | Taylor John D | $250,000 | |
| Previous Owner | Patel Suryakant A | $44,250 |
Source: Public Records
Tax History Compared to Growth
Tax History
| Year | Tax Paid | Tax Assessment Tax Assessment Total Assessment is a certain percentage of the fair market value that is determined by local assessors to be the total taxable value of land and additions on the property. | Land | Improvement |
|---|---|---|---|---|
| 2024 | $8,626 | $138,506 | $22,393 | $116,113 |
| 2023 | $8,415 | $123,832 | $20,021 | $103,811 |
| 2022 | $8,013 | $112,831 | $18,242 | $94,589 |
| 2021 | $7,149 | $106,535 | $17,224 | $89,311 |
| 2020 | $7,130 | $105,002 | $16,976 | $88,026 |
| 2019 | $7,033 | $103,461 | $16,727 | $86,734 |
| 2018 | $7,023 | $103,461 | $16,727 | $86,734 |
| 2017 | $6,953 | $101,942 | $16,481 | $85,461 |
| 2016 | $7,378 | $99,368 | $16,065 | $83,303 |
| 2015 | -- | $96,624 | $15,621 | $81,003 |
| 2014 | -- | $90,509 | $15,860 | $74,649 |
| 2013 | -- | $92,027 | $16,126 | $75,901 |
Source: Public Records
Map
Nearby Homes
- 41W455 Brierwood Dr
- 41W540 Burlington Rd
- 7N072 Willowbrook Dr
- 42W316 Silver Glen Rd
- 6N679 Colonel Bennett Ln
- 7N107 Hastings Dr
- 7N075 Hastings Dr
- 40W630 Winchester Way
- 1831 Chandolin Ln
- 1855 Chandolin Ln
- 41W591 Lenz Rd
- 42W534 Empire Rd
- 5N683 Ravine Dr
- 3667 Thornhill Dr
- 39W841 Prunetree Ln
- 3620 Sahara Rd
- 1857 Chandolin Ln
- 1865 Chandolin Ln
- 1863 Chandolin Ln
- 1854 Chandolin Ln
- 7N309 Fox Bend Dr
- 7N241 Fox Bend Dr
- 7N290 Fox Bend Dr Unit 2
- 7N339 Fox Bend Dr
- 7N207 Fox Bend Dr
- 7N324 Fox Bend Dr
- 41W608 Foxtail Cir
- 7N365 Fox Bend Dr
- 7N366 Fox Bend Dr
- 7N175 Fox Bend Dr
- 7N172 Fox Bend Dr
- 41W652 Foxtail Cir
- 7N349 Red Barn Ln
- 7N311 Red Barn Ln
- 7N145 Fox Bend Dr
- 7N410 Fox Bend Dr Unit 2
- 7N295 Red Barn Ln Unit 2
- 7N375 Red Barn Ln
- 41W694 Foxtail Cir Unit 1
- 41W665 Foxtail Cir