Estimated Value: $367,285 - $501,000
Studio
--
Bath
1,848
Sq Ft
$225/Sq Ft
Est. Value
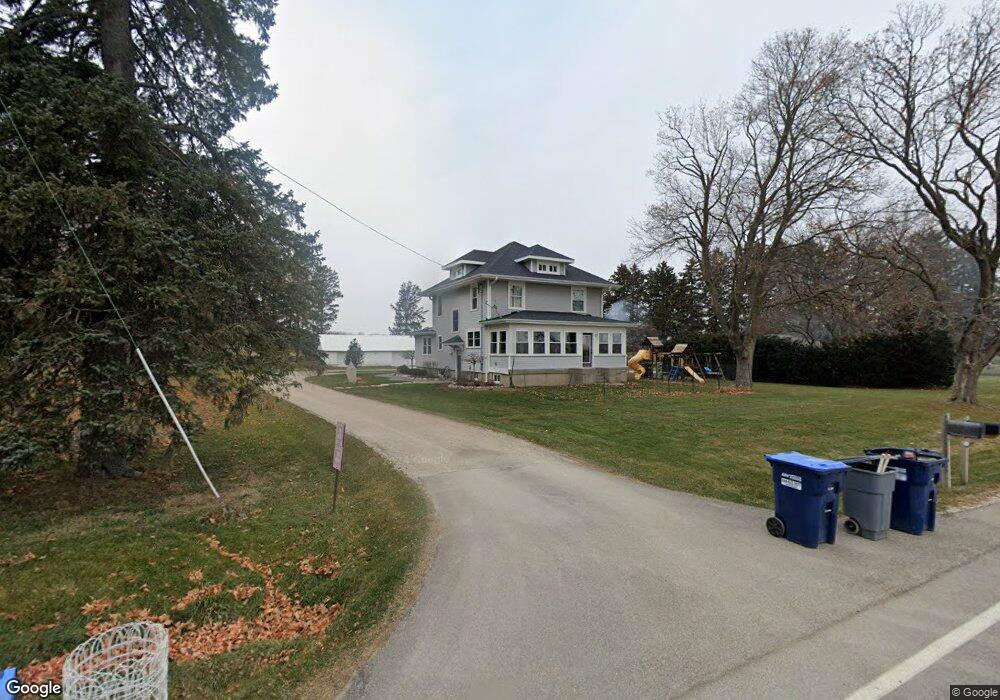
About This Home
This home is located at 7N470 Dittman Rd, Elgin, IL 60124 and is currently estimated at $415,571, approximately $224 per square foot. 7N470 Dittman Rd is a home located in Kane County with nearby schools including Lily Lake Grade School, Central Middle School, and Prairie Knolls Middle School.
Ownership History
Date
Name
Owned For
Owner Type
Purchase Details
Closed on
Oct 11, 2021
Sold by
Knaack Keith and Knaack Roberta
Bought by
Rebecca Kurt Knaack and Knaack Rebecca
Current Estimated Value
Purchase Details
Closed on
Oct 8, 2002
Sold by
Schramm Linda Kay
Bought by
Knaack Keith and Knaack Roberta
Home Financials for this Owner
Home Financials are based on the most recent Mortgage that was taken out on this home.
Original Mortgage
$320,000
Interest Rate
6.8%
Mortgage Type
Purchase Money Mortgage
Purchase Details
Closed on
Nov 7, 2000
Sold by
Schramm Kerwin and Schramm Linda
Bought by
Schramm Linda Kay
Purchase Details
Closed on
Jan 4, 2000
Sold by
Schramm Kerwin V and Schramm Linda Kay
Bought by
Post Gerald H and Post Regina A
Purchase Details
Closed on
Oct 29, 1998
Sold by
Schramm Kerwin and Schramm Linda
Bought by
Schramm Linda Kay
Create a Home Valuation Report for This Property
The Home Valuation Report is an in-depth analysis detailing your home's value as well as a comparison with similar homes in the area
Home Values in the Area
Average Home Value in this Area
Purchase History
| Date | Buyer | Sale Price | Title Company |
|---|---|---|---|
| Rebecca Kurt Knaack | -- | None Available | |
| Knaack Keith | $295,000 | Chicago Title Insurance Co | |
| Schramm Linda Kay | -- | -- | |
| Post Gerald H | $522,500 | Chicago Title Insurance Co | |
| Post Gerald H | -- | Chicago Title Insurance Co | |
| Schramm Linda Kay | -- | -- |
Source: Public Records
Mortgage History
| Date | Status | Borrower | Loan Amount |
|---|---|---|---|
| Previous Owner | Knaack Keith | $320,000 |
Source: Public Records
Tax History
| Year | Tax Paid | Tax Assessment Tax Assessment Total Assessment is a certain percentage of the fair market value that is determined by local assessors to be the total taxable value of land and additions on the property. | Land | Improvement |
|---|---|---|---|---|
| 2024 | $7,062 | $89,218 | $17,707 | $71,511 |
| 2023 | $6,897 | $79,766 | $15,831 | $63,935 |
| 2022 | $6,262 | $69,267 | $14,425 | $54,842 |
| 2021 | $6,085 | $65,402 | $13,620 | $51,782 |
| 2020 | $6,083 | $64,461 | $13,424 | $51,037 |
| 2019 | $6,068 | $63,515 | $13,227 | $50,288 |
| 2018 | $6,024 | $63,515 | $13,227 | $50,288 |
| 2017 | $5,991 | $62,583 | $13,033 | $49,550 |
| 2016 | $6,314 | $61,003 | $12,704 | $48,299 |
| 2015 | -- | $59,318 | $12,353 | $46,965 |
| 2014 | -- | $48,261 | $12,542 | $35,719 |
| 2013 | -- | $49,070 | $12,752 | $36,318 |
Source: Public Records
Map
Nearby Homes
- 1855 Chandolin Ln
- 41W461 Burlington Rd
- 7N764 Il Route 47
- 24 Autumn Ct
- 5N975 E Sunset Views Dr
- 42W439 Sylvan Ln
- 42W668 Steeplechase
- 42W470 Red Bud Ct
- 42W231 Retreat Ct Unit 1
- 40W412 Winchester Way
- 40W789 Whitney Rd
- 3660 Thornhill Dr
- 3620 Sahara Rd
- 1858 Chandolin Ln
- 1854 Chandolin Ln
- 1853 Chandolin Ln
- 1857 Chandolin Ln
- 1865 Chandolin Ln
- 1863 Chandolin Ln
- 1867 Chandolin Ln
- 42W430 Burlington Rd
- 42w Burlington Rd
- 7N490 Dittman Rd
- 7N720 Dittman Rd
- 42W472 Burlington Rd
- 7n778 Dittman Rd
- 1 Dittman Rd
- 42W461 Burlington Rd
- 7N524 Dittman Rd
- 7N401 Dittman Rd
- 7N404 Dittman Rd
- 42W417 Burlington Rd
- 42W375 Burlington Rd
- 42W457 Burlington Rd
- 7N819 Dittman Rd
- 7N202 Nancy Ln
- 42W453 Evening Lake Dr
- 42W449 Evening Lake Dr
- 7N180 Nancy Ln
- 42W453 Burlington Rd
Your Personal Tour Guide
Ask me questions while you tour the home.