8 10th St Newbury, MA 01951
Estimated Value: $913,305 - $1,049,000
6
Beds
2
Baths
1,535
Sq Ft
$652/Sq Ft
Est. Value
About This Home
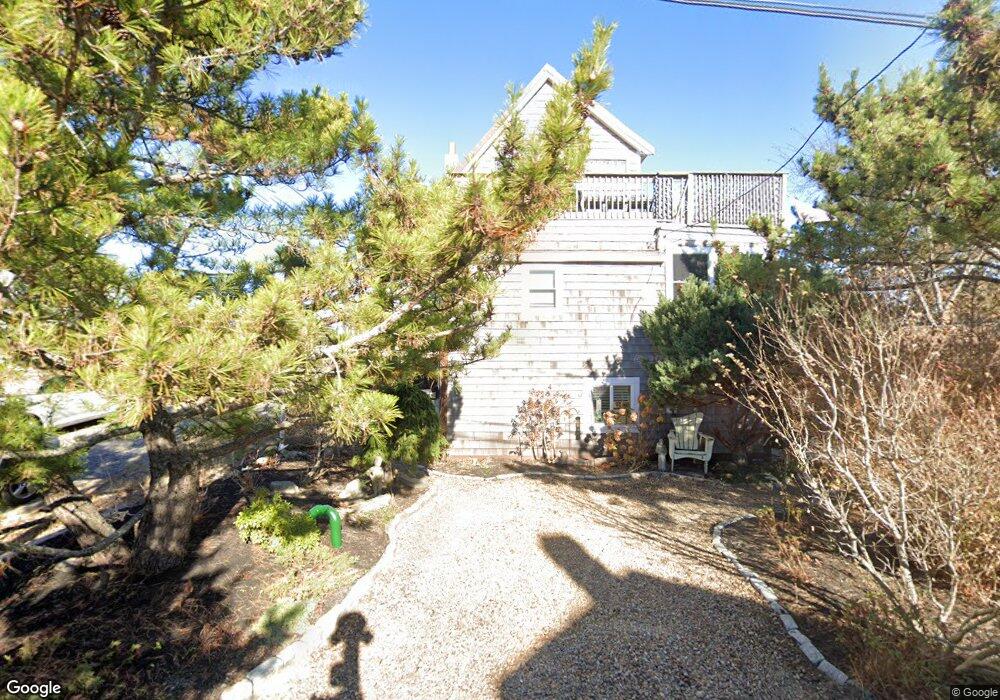
This home is located at 8 10th St, Newbury, MA 01951 and is currently estimated at $1,000,576, approximately $651 per square foot. 8 10th St is a home located in Essex County with nearby schools including Triton Regional High School, River Valley Charter School, and Immaculate Conception School.
Ownership History
Date
Name
Owned For
Owner Type
Purchase Details
Closed on
Sep 4, 2019
Sold by
Brook Michael C Est
Bought by
Fisher Verne
Current Estimated Value
Purchase Details
Closed on
Jun 13, 2003
Sold by
Cab Nt and Brook Carol A
Bought by
Brook Carol A
Create a Home Valuation Report for This Property
The Home Valuation Report is an in-depth analysis detailing your home's value as well as a comparison with similar homes in the area
Home Values in the Area
Average Home Value in this Area
Purchase History
| Date | Buyer | Sale Price | Title Company |
|---|---|---|---|
| Fisher Verne | -- | -- | |
| Fisher Verne | -- | -- | |
| Fisher Verne | -- | -- | |
| Brook Carol A | -- | -- | |
| Brook Carol A | -- | -- |
Source: Public Records
Mortgage History
| Date | Status | Borrower | Loan Amount |
|---|---|---|---|
| Previous Owner | Brook Carol A | $144,000 | |
| Previous Owner | Brook Carol A | $125,000 | |
| Previous Owner | Brook Carol A | $109,500 |
Source: Public Records
Tax History
| Year | Tax Paid | Tax Assessment Tax Assessment Total Assessment is a certain percentage of the fair market value that is determined by local assessors to be the total taxable value of land and additions on the property. | Land | Improvement |
|---|---|---|---|---|
| 2025 | $6,013 | $807,100 | $457,400 | $349,700 |
| 2024 | $5,524 | $719,300 | $417,600 | $301,700 |
| 2023 | $5,255 | $606,100 | $348,000 | $258,100 |
| 2022 | $4,785 | $491,800 | $268,500 | $223,300 |
| 2021 | $4,436 | $416,100 | $218,800 | $197,300 |
| 2020 | $4,382 | $398,700 | $218,800 | $179,900 |
| 2019 | $4,310 | $398,700 | $218,800 | $179,900 |
| 2018 | $3,939 | $361,400 | $198,900 | $162,500 |
| 2017 | $3,834 | $361,400 | $198,900 | $162,500 |
| 2016 | $3,704 | $324,900 | $159,100 | $165,800 |
| 2015 | $3,629 | $315,000 | $149,200 | $165,800 |
| 2014 | $3,566 | $315,000 | $149,200 | $165,800 |
Source: Public Records
Map
Nearby Homes
- 49 Northern Blvd
- 5 Northern Blvd
- 2 Plum Island Blvd
- 11 Sunset Dr
- 5 Cinder Ave
- 4 Anchor Ave
- 2 Sunset Dr
- 12 53rd St
- 10 61st St Unit 10
- 28 & 30 Plum Island Turnpike
- 10 Meadowview Ln Unit B
- 4 Goodwin Ave
- 83 High Rd
- 4 Gadsden Ln
- 1 Littles Ln
- 26 Beacon Ave
- 6 S Pond St
- 114 Railroad Ave
- 4 Knights Ct
- 103 Railroad Ave
Your Personal Tour Guide
Ask me questions while you tour the home.