8 3 Jays Rd Ashburnham, MA 01430
Estimated Value: $224,000 - $351,000
3
Beds
1
Bath
1,432
Sq Ft
$214/Sq Ft
Est. Value
About This Home
This home is located at 8 3 Jays Rd, Ashburnham, MA 01430 and is currently estimated at $306,232, approximately $213 per square foot. 8 3 Jays Rd is a home located in Worcester County with nearby schools including Oakmont Regional High School and Cushing Academy.
Ownership History
Date
Name
Owned For
Owner Type
Purchase Details
Closed on
May 28, 2004
Sold by
Hanes Donald G
Bought by
Callahan Barry
Current Estimated Value
Home Financials for this Owner
Home Financials are based on the most recent Mortgage that was taken out on this home.
Original Mortgage
$142,500
Outstanding Balance
$67,064
Interest Rate
5.88%
Mortgage Type
Purchase Money Mortgage
Estimated Equity
$239,168
Purchase Details
Closed on
Dec 9, 1996
Sold by
Winter Kevin J and Winter Susan M
Bought by
Hanes Donald G
Purchase Details
Closed on
Feb 27, 1995
Sold by
Emc Mtg Corp
Bought by
Winter Kevin J and Winter Susan M
Purchase Details
Closed on
Dec 15, 1994
Sold by
Meridian Mtg Corp
Bought by
Emc Mtg Corp
Purchase Details
Closed on
Aug 11, 1987
Sold by
Pioli William J
Bought by
Miller Paul J
Create a Home Valuation Report for This Property
The Home Valuation Report is an in-depth analysis detailing your home's value as well as a comparison with similar homes in the area
Home Values in the Area
Average Home Value in this Area
Purchase History
| Date | Buyer | Sale Price | Title Company |
|---|---|---|---|
| Callahan Barry | $150,000 | -- | |
| Callahan Barry | $150,000 | -- | |
| Callahan Barry | $150,000 | -- | |
| Hanes Donald G | $69,900 | -- | |
| Hanes Donald G | $69,900 | -- | |
| Winter Kevin J | $30,000 | -- | |
| Winter Kevin J | $30,000 | -- | |
| Emc Mtg Corp | $29,929 | -- | |
| Emc Mtg Corp | $29,929 | -- | |
| Miller Paul J | $84,900 | -- |
Source: Public Records
Mortgage History
| Date | Status | Borrower | Loan Amount |
|---|---|---|---|
| Open | Callahan Barry | $142,500 | |
| Closed | Miller Paul J | $142,500 |
Source: Public Records
Tax History
| Year | Tax Paid | Tax Assessment Tax Assessment Total Assessment is a certain percentage of the fair market value that is determined by local assessors to be the total taxable value of land and additions on the property. | Land | Improvement |
|---|---|---|---|---|
| 2025 | $3,274 | $220,200 | $35,000 | $185,200 |
| 2024 | $3,226 | $204,800 | $35,000 | $169,800 |
| 2023 | $3,293 | $199,000 | $35,000 | $164,000 |
| 2022 | $3,423 | $181,300 | $34,700 | $146,600 |
| 2021 | $6,360 | $161,700 | $34,700 | $127,000 |
| 2020 | $17,620 | $161,700 | $34,700 | $127,000 |
| 2019 | $3,031 | $134,400 | $34,700 | $99,700 |
| 2018 | $2,859 | $122,200 | $33,000 | $89,200 |
| 2017 | $2,812 | $122,400 | $36,400 | $86,000 |
| 2016 | $2,994 | $131,600 | $35,700 | $95,900 |
| 2015 | $2,932 | $131,600 | $35,700 | $95,900 |
Source: Public Records
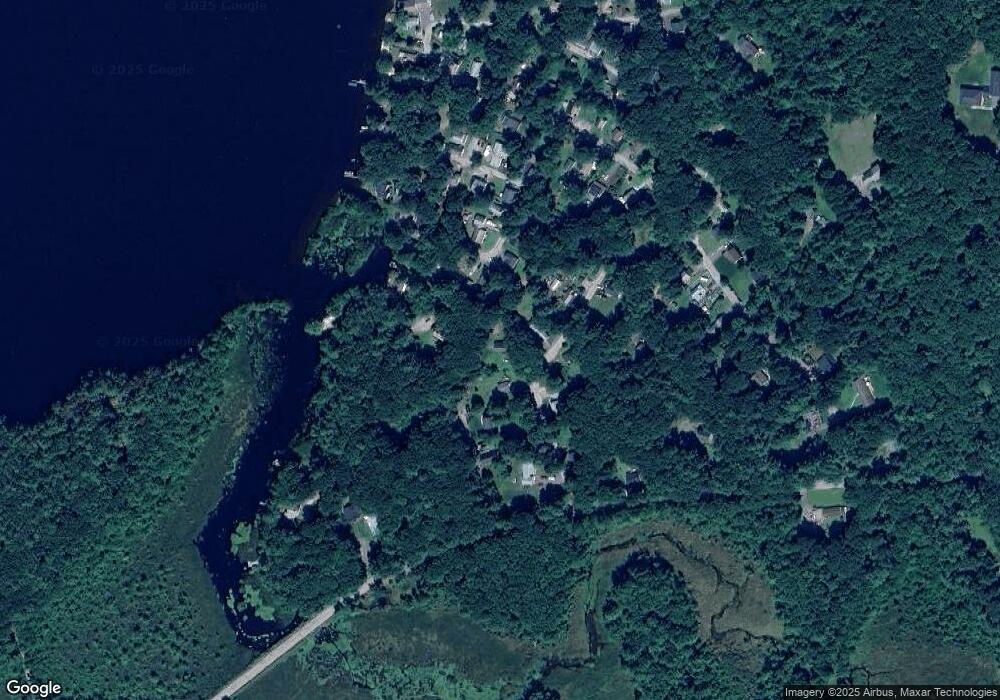
Map
Nearby Homes
Your Personal Tour Guide
Ask me questions while you tour the home.