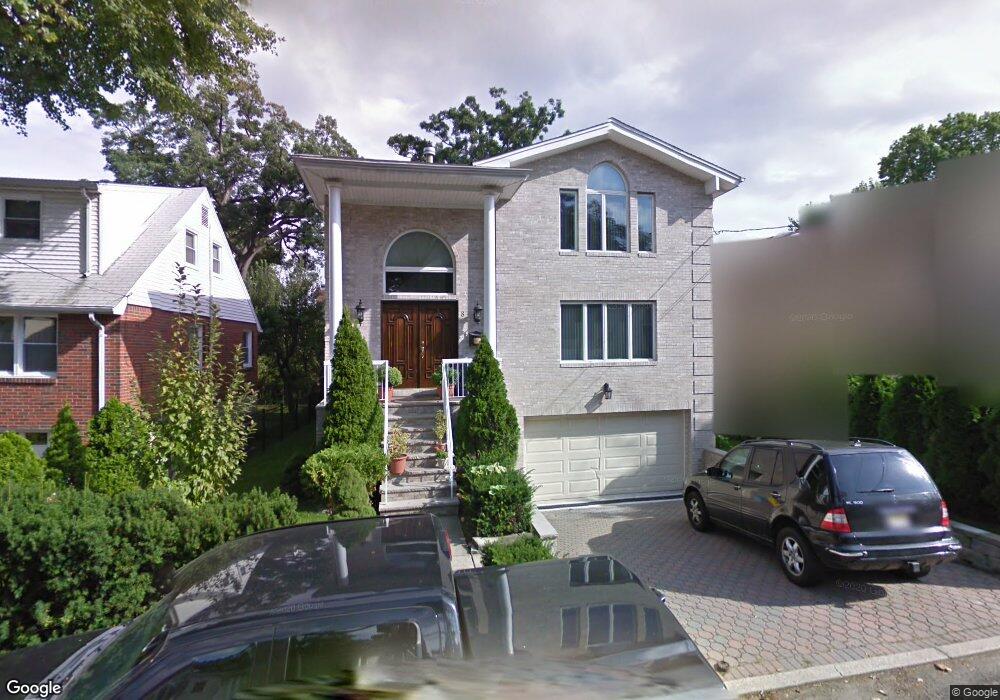
8 6th St Englewood Cliffs, NJ 07632
Estimated Value: $1,261,235 - $1,785,000
Studio
--
Bath
2,756
Sq Ft
$549/Sq Ft
Est. Value
About This Home
This home is located at 8 6th St, Englewood Cliffs, NJ 07632 and is currently estimated at $1,514,309, approximately $549 per square foot. 8 6th St is a home located in Bergen County with nearby schools including North Cliff Elementary School, Upper School Elementary School, and Christ the Teacher Academy.
Ownership History
Date
Name
Owned For
Owner Type
Purchase Details
Closed on
Jan 19, 2010
Sold by
Chiang Frankie and Chiang Alice
Bought by
Park Mark M and Park Kyung
Current Estimated Value
Home Financials for this Owner
Home Financials are based on the most recent Mortgage that was taken out on this home.
Original Mortgage
$700,000
Interest Rate
4.31%
Mortgage Type
Purchase Money Mortgage
Purchase Details
Closed on
Mar 19, 1998
Sold by
Najjar Yahia
Bought by
Chiang Frankie and Chiang Alice
Home Financials for this Owner
Home Financials are based on the most recent Mortgage that was taken out on this home.
Original Mortgage
$350,000
Interest Rate
6.96%
Purchase Details
Closed on
Jul 31, 1997
Sold by
Liang Tsang and Lin Lee Li Jen
Bought by
Najjar Yahia
Home Financials for this Owner
Home Financials are based on the most recent Mortgage that was taken out on this home.
Original Mortgage
$200,000
Interest Rate
7.42%
Create a Home Valuation Report for This Property
The Home Valuation Report is an in-depth analysis detailing your home's value as well as a comparison with similar homes in the area
Home Values in the Area
Average Home Value in this Area
Purchase History
| Date | Buyer | Sale Price | Title Company |
|---|---|---|---|
| Park Mark M | $990,000 | -- | |
| Chiang Frankie | $550,000 | -- | |
| Najjar Yahia | $235,000 | -- |
Source: Public Records
Mortgage History
| Date | Status | Borrower | Loan Amount |
|---|---|---|---|
| Closed | Park Mark M | $700,000 | |
| Previous Owner | Chiang Frankie | $350,000 | |
| Previous Owner | Najjar Yahia | $200,000 |
Source: Public Records
Tax History
| Year | Tax Paid | Tax Assessment Tax Assessment Total Assessment is a certain percentage of the fair market value that is determined by local assessors to be the total taxable value of land and additions on the property. | Land | Improvement |
|---|---|---|---|---|
| 2025 | $10,973 | $950,000 | $425,000 | $525,000 |
| 2024 | $10,840 | $950,000 | $425,000 | $525,000 |
| 2023 | $10,669 | $950,000 | $425,000 | $525,000 |
| 2022 | $10,669 | $950,000 | $425,000 | $525,000 |
| 2021 | $10,678 | $950,000 | $425,000 | $525,000 |
| 2020 | $10,935 | $950,000 | $425,000 | $525,000 |
| 2019 | $10,270 | $950,000 | $425,000 | $525,000 |
| 2018 | $9,909 | $950,000 | $425,000 | $525,000 |
| 2017 | $9,481 | $950,000 | $425,000 | $525,000 |
| 2016 | $9,301 | $950,000 | $425,000 | $525,000 |
| 2015 | $8,835 | $950,000 | $425,000 | $525,000 |
| 2014 | $8,265 | $950,000 | $425,000 | $525,000 |
Source: Public Records
Map
Nearby Homes
- 2481 8th St
- 2468 7th St Unit B
- 54 Van Nostrand Ave
- 230B Washington Ave
- 2430 8th St Unit 5B
- 2410 3rd St
- 220B Washington Ave Unit 220B
- 1 Wall St Unit 1F
- 1 Wall St Unit 8-C
- 1 Wall St Unit 1E
- 2335 Hudson Terrace Unit A7
- 2337 Hudson Terrace Unit B10
- 2329 Hudson Terrace Unit C3
- 2329 Hudson Terrace Unit C13
- 2451 Camner St Unit 2451
- 2447 Camner St
- 2449 Camner St
- 2348 Linwood Ave Unit 3L
- 2350 Linwood Ave Unit 5C
- 2350 Linwood Ave Unit 1D
Your Personal Tour Guide
Ask me questions while you tour the home.