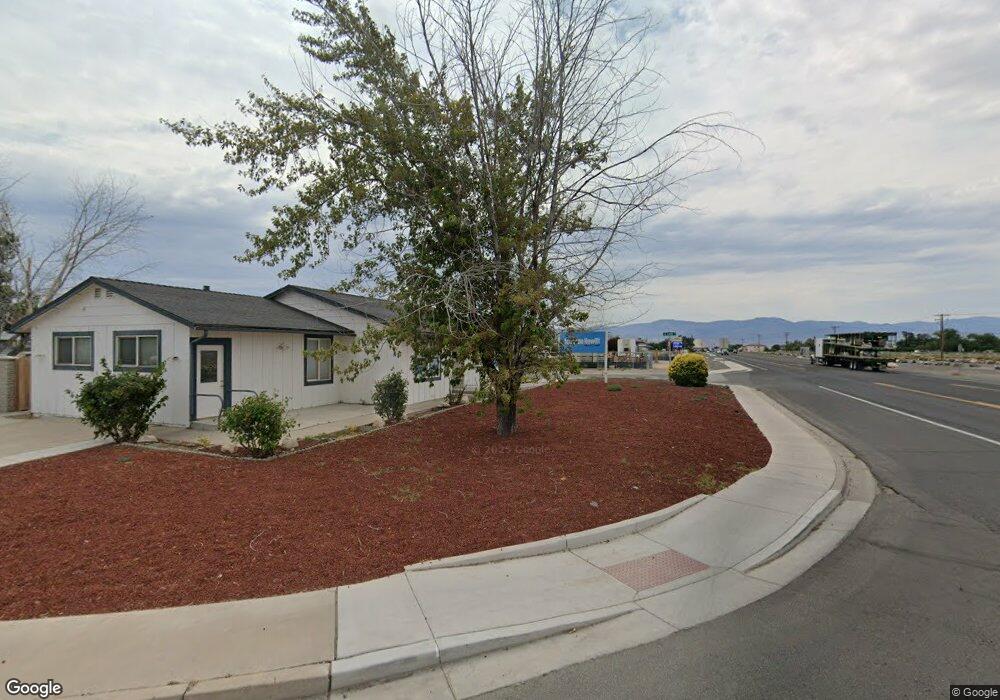
8 6th St Fernley, NV 89408
Estimated Value: $484,283
3
Beds
2
Baths
1,284
Sq Ft
$377/Sq Ft
Est. Value
About This Home
This home is located at 8 6th St, Fernley, NV 89408 and is currently estimated at $484,283, approximately $377 per square foot. 8 6th St is a home located in Lyon County with nearby schools including Fernley Elementary School, Fernley Intermediate School, and Fernley High School.
Ownership History
Date
Name
Owned For
Owner Type
Purchase Details
Closed on
Jul 16, 2025
Sold by
Valenzuela Petra
Bought by
Valenzuela Phillip L
Current Estimated Value
Home Financials for this Owner
Home Financials are based on the most recent Mortgage that was taken out on this home.
Original Mortgage
$325,000
Outstanding Balance
$324,450
Interest Rate
6.85%
Mortgage Type
Seller Take Back
Estimated Equity
$159,833
Purchase Details
Closed on
Jul 10, 2025
Sold by
Valenzuela Phillip L
Bought by
Fernley Frontier Properties Llc
Home Financials for this Owner
Home Financials are based on the most recent Mortgage that was taken out on this home.
Original Mortgage
$325,000
Outstanding Balance
$324,450
Interest Rate
6.85%
Mortgage Type
Seller Take Back
Estimated Equity
$159,833
Purchase Details
Closed on
Sep 16, 2005
Sold by
Maclaurin John R and Maclaurin Suzanne M
Bought by
Valenzuela Phillip L and Valenzuela Jennelle
Home Financials for this Owner
Home Financials are based on the most recent Mortgage that was taken out on this home.
Original Mortgage
$168,000
Interest Rate
5.63%
Mortgage Type
Commercial
Create a Home Valuation Report for This Property
The Home Valuation Report is an in-depth analysis detailing your home's value as well as a comparison with similar homes in the area
Home Values in the Area
Average Home Value in this Area
Purchase History
| Date | Buyer | Sale Price | Title Company |
|---|---|---|---|
| Valenzuela Phillip L | -- | Stewart Title Company | |
| Fernley Frontier Properties Llc | $475,000 | Stewart Title Company | |
| Valenzuela Phillip L | $290,000 | Western Title Company Inc |
Source: Public Records
Mortgage History
| Date | Status | Borrower | Loan Amount |
|---|---|---|---|
| Open | Fernley Frontier Properties Llc | $325,000 | |
| Previous Owner | Valenzuela Phillip L | $168,000 |
Source: Public Records
Tax History Compared to Growth
Tax History
| Year | Tax Paid | Tax Assessment Tax Assessment Total Assessment is a certain percentage of the fair market value that is determined by local assessors to be the total taxable value of land and additions on the property. | Land | Improvement |
|---|---|---|---|---|
| 2025 | $2,982 | $96,007 | $58,541 | $37,466 |
| 2024 | $3,171 | $97,033 | $58,541 | $38,491 |
| 2023 | $3,171 | $94,704 | $58,541 | $36,163 |
| 2022 | $2,758 | $91,795 | $58,541 | $33,254 |
| 2021 | $2,610 | $91,441 | $58,541 | $32,900 |
| 2020 | $2,444 | $90,618 | $58,540 | $32,078 |
| 2019 | $2,334 | $51,746 | $20,490 | $31,256 |
| 2018 | $2,317 | $51,252 | $20,490 | $30,762 |
| 2017 | $2,357 | $51,563 | $20,490 | $31,073 |
| 2016 | $2,153 | $52,611 | $20,490 | $32,121 |
| 2015 | $2,186 | $49,327 | $20,490 | $28,837 |
| 2014 | $2,130 | $48,874 | $20,490 | $28,384 |
Source: Public Records
Map
Nearby Homes