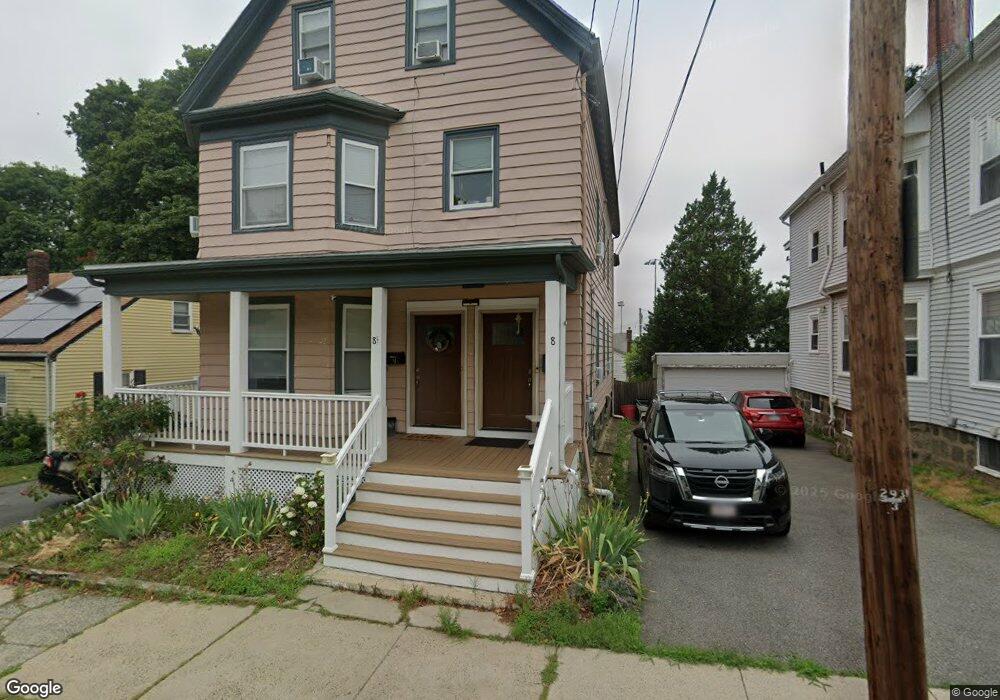
8 - 8 1/2 Charles St Salem, MA 01970
South Salem NeighborhoodEstimated Value: $789,000 - $989,000
6
Beds
2
Baths
3,087
Sq Ft
$282/Sq Ft
Est. Value
About This Home
This home is located at 8 - 8 1/2 Charles St, Salem, MA 01970 and is currently estimated at $869,354, approximately $281 per square foot. 8 - 8 1/2 Charles St is a home located in Essex County with nearby schools including Saltonstall School, Horace Mann Laboratory, and Carlton Elementary School.
Ownership History
Date
Name
Owned For
Owner Type
Purchase Details
Closed on
Jul 28, 2017
Sold by
Monegro Robert
Bought by
Monegro Robert A
Current Estimated Value
Home Financials for this Owner
Home Financials are based on the most recent Mortgage that was taken out on this home.
Original Mortgage
$324,000
Outstanding Balance
$268,030
Interest Rate
3.91%
Mortgage Type
New Conventional
Estimated Equity
$601,324
Purchase Details
Closed on
May 1, 2017
Sold by
Monegro Robert
Bought by
Monegro Robert
Purchase Details
Closed on
Dec 22, 2010
Sold by
Manahan Scott I
Bought by
Monegro Robert
Home Financials for this Owner
Home Financials are based on the most recent Mortgage that was taken out on this home.
Original Mortgage
$6,750
Interest Rate
4.62%
Purchase Details
Closed on
Feb 2, 2010
Sold by
Robinson-Manahan Diane and Manahan Diane R
Bought by
Manahan Scott I
Purchase Details
Closed on
Mar 4, 2003
Sold by
Swartz Gary S
Bought by
Manahan Scott I
Purchase Details
Closed on
Sep 11, 1995
Sold by
Fredriksen Ingeborg E and Rodgers Susanna
Bought by
Swartz Gary S
Purchase Details
Closed on
Jun 30, 1994
Sold by
Heritage Coop Bank
Bought by
Fredriksen Ingeborg E and Rodgers Susanna A
Purchase Details
Closed on
Jun 9, 1994
Sold by
Oneill William P
Bought by
Heritage Coop Bank
Create a Home Valuation Report for This Property
The Home Valuation Report is an in-depth analysis detailing your home's value as well as a comparison with similar homes in the area
Home Values in the Area
Average Home Value in this Area
Purchase History
| Date | Buyer | Sale Price | Title Company |
|---|---|---|---|
| Monegro Robert A | -- | -- | |
| Monegro Robert | -- | -- | |
| Monegro Robert | $295,000 | -- | |
| Manahan Scott I | -- | -- | |
| Manahan Scott I | $382,000 | -- | |
| Swartz Gary S | $139,000 | -- | |
| Fredriksen Ingeborg E | $122,300 | -- | |
| Heritage Coop Bank | $110,000 | -- |
Source: Public Records
Mortgage History
| Date | Status | Borrower | Loan Amount |
|---|---|---|---|
| Open | Monegro Robert A | $324,000 | |
| Previous Owner | Heritage Coop Bank | $6,750 | |
| Previous Owner | Heritage Coop Bank | $287,521 |
Source: Public Records
Tax History Compared to Growth
Tax History
| Year | Tax Paid | Tax Assessment Tax Assessment Total Assessment is a certain percentage of the fair market value that is determined by local assessors to be the total taxable value of land and additions on the property. | Land | Improvement |
|---|---|---|---|---|
| 2025 | $7,949 | $701,000 | $200,100 | $500,900 |
| 2024 | $7,331 | $630,900 | $190,100 | $440,800 |
| 2023 | $7,073 | $565,400 | $175,500 | $389,900 |
| 2022 | $7,264 | $548,200 | $169,700 | $378,500 |
| 2021 | $6,888 | $499,100 | $158,000 | $341,100 |
| 2020 | $6,771 | $468,600 | $149,200 | $319,400 |
| 2019 | $6,704 | $444,000 | $141,600 | $302,400 |
| 2018 | $6,200 | $403,100 | $134,600 | $268,500 |
| 2017 | $5,789 | $365,000 | $113,500 | $251,500 |
| 2016 | $5,636 | $359,700 | $108,200 | $251,500 |
| 2015 | $5,481 | $334,000 | $99,500 | $234,500 |
Source: Public Records
Map
Nearby Homes
- 24 Wisteria St Unit 2
- 327 Lafayette St Unit 2
- 17 Cliff St
- 14 Meadow St
- 4 Willow Ave Unit 2
- 10 Hazel St Unit 2
- 263 Jefferson Ave
- 436 Lafayette St
- 11 Sumner Rd
- 2A Hazel St Unit 3
- 1 Laurent Rd Unit 3
- 9 Glover St Unit 1
- 10 Horton St
- 10 Quadrant Rd
- 29 Willson St
- 23 Marion Rd Unit B
- 9 Lyme St
- 7 Fairfield St
- 2 Fletcher Way Unit 34D
- 16 Leavitt St Unit 2
- 8 Charles St
- 6 Charles St Unit 2
- 6 Charles St Unit 1
- 6 Charles St
- 10 Charles St
- 9 Day Ave
- 7 Day Ave
- 4 Charles St
- 12 Charles St Unit 3
- 18 Charles St
- 7 Charles St
- 1 Day Ave
- 5 Charles St Unit 2
- 3-5 Charles St
- 5 Charles St
- 22 Charles St
- 3 Charles St Unit 2
- 3 Charles St Unit 1
- 106 Linden St
- 104 Linden St