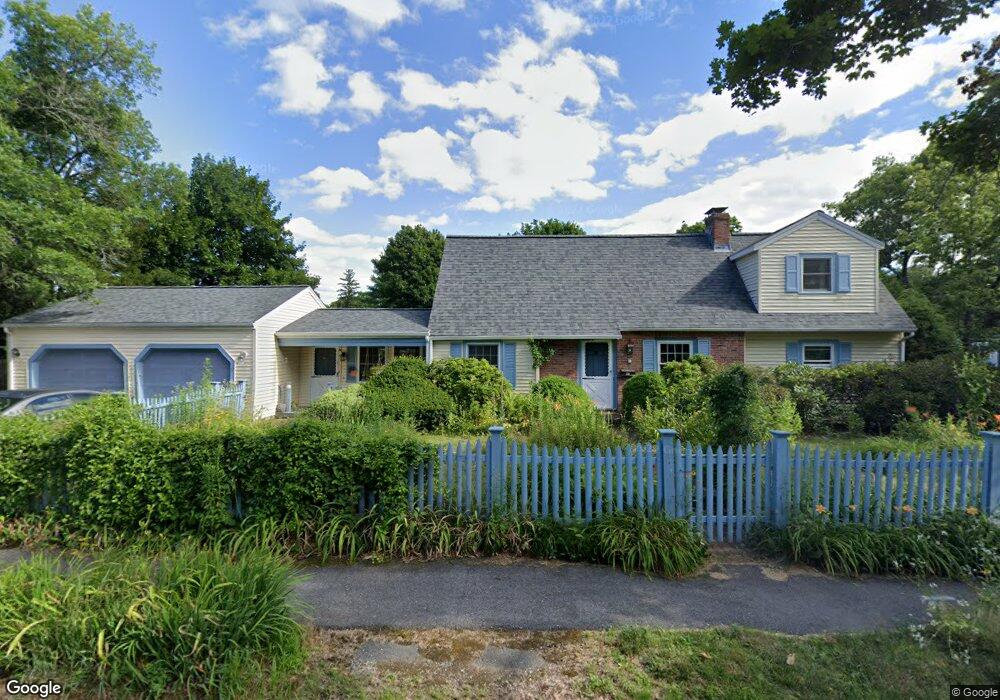
8 Abbott Rd Natick, MA 01760
Estimated Value: $853,355 - $1,048,000
3
Beds
2
Baths
2,000
Sq Ft
$469/Sq Ft
Est. Value
About This Home
This home is located at 8 Abbott Rd, Natick, MA 01760 and is currently estimated at $937,089, approximately $468 per square foot. 8 Abbott Rd is a home located in Middlesex County with nearby schools including Natick High School, Wilson Middle School, and Bennett-Hemenway (Ben-Hem) Elementary School.
Ownership History
Date
Name
Owned For
Owner Type
Purchase Details
Closed on
Mar 15, 2002
Sold by
Mcgillicuddy Brian C and Mcgillicuddy Kathleen
Bought by
Fuhro Robert L and Fuhro Sarah
Current Estimated Value
Purchase Details
Closed on
Aug 14, 1989
Sold by
Tobio Frederick R
Bought by
Brian C-Mcgillicuddy
Home Financials for this Owner
Home Financials are based on the most recent Mortgage that was taken out on this home.
Original Mortgage
$187,500
Interest Rate
9.93%
Mortgage Type
Purchase Money Mortgage
Create a Home Valuation Report for This Property
The Home Valuation Report is an in-depth analysis detailing your home's value as well as a comparison with similar homes in the area
Home Values in the Area
Average Home Value in this Area
Purchase History
| Date | Buyer | Sale Price | Title Company |
|---|---|---|---|
| Fuhro Robert L | $399,900 | -- | |
| Brian C-Mcgillicuddy | $208,400 | -- |
Source: Public Records
Mortgage History
| Date | Status | Borrower | Loan Amount |
|---|---|---|---|
| Previous Owner | Brian C-Mcgillicuddy | $147,000 | |
| Previous Owner | Brian C-Mcgillicuddy | $160,000 | |
| Previous Owner | Brian C-Mcgillicuddy | $187,500 |
Source: Public Records
Tax History
| Year | Tax Paid | Tax Assessment Tax Assessment Total Assessment is a certain percentage of the fair market value that is determined by local assessors to be the total taxable value of land and additions on the property. | Land | Improvement |
|---|---|---|---|---|
| 2025 | $8,288 | $693,000 | $425,100 | $267,900 |
| 2024 | $7,963 | $649,500 | $400,100 | $249,400 |
| 2023 | $7,994 | $632,400 | $385,100 | $247,300 |
| 2022 | $7,755 | $581,300 | $350,100 | $231,200 |
| 2021 | $7,434 | $546,200 | $330,100 | $216,100 |
| 2020 | $7,230 | $531,200 | $315,100 | $216,100 |
| 2019 | $6,752 | $531,200 | $315,100 | $216,100 |
| 2018 | $6,274 | $480,800 | $300,100 | $180,700 |
| 2017 | $5,834 | $432,500 | $255,100 | $177,400 |
| 2016 | $5,432 | $400,300 | $234,100 | $166,200 |
| 2015 | $5,346 | $386,800 | $234,100 | $152,700 |
Source: Public Records
Map
Nearby Homes
Your Personal Tour Guide
Ask me questions while you tour the home.