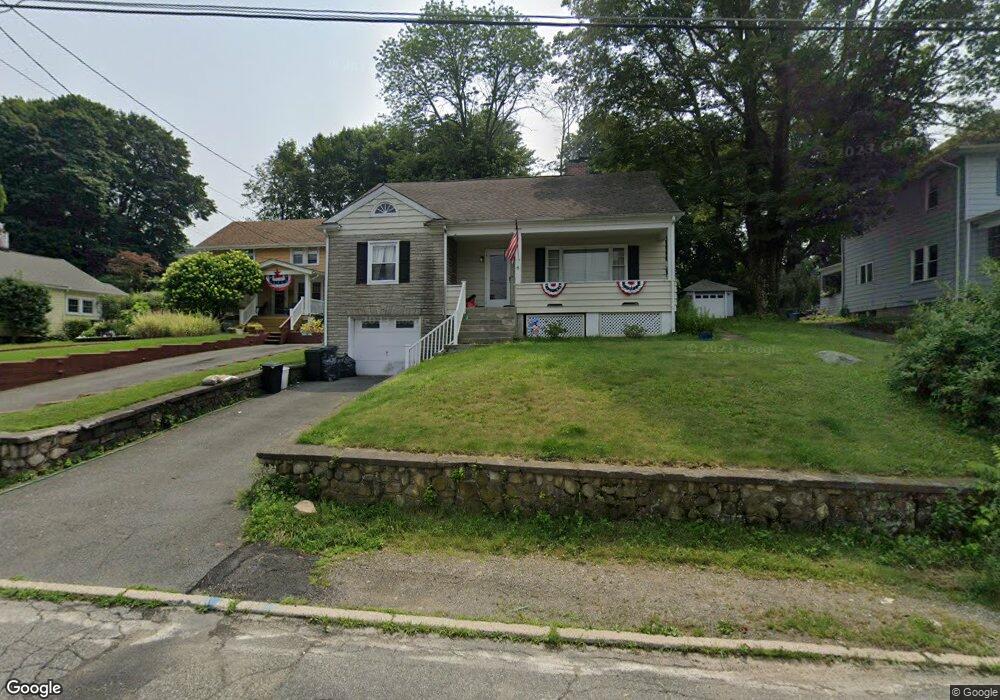
8 Allen Terrace Netcong, NJ 07857
Estimated Value: $366,369 - $498,000
Studio
--
Bath
1,142
Sq Ft
$388/Sq Ft
Est. Value
About This Home
This home is located at 8 Allen Terrace, Netcong, NJ 07857 and is currently estimated at $442,592, approximately $387 per square foot. 8 Allen Terrace is a home located in Morris County with nearby schools including Netcong Elementary School and Lenape Val Regional High School.
Ownership History
Date
Name
Owned For
Owner Type
Purchase Details
Closed on
Sep 24, 2018
Sold by
Rosequist Sharon
Bought by
Milone Clapp Kerry and Milone Clapp Thomas John
Current Estimated Value
Purchase Details
Closed on
Jul 31, 1996
Sold by
Schomp Roberta H
Bought by
Rosequist Sharon
Create a Home Valuation Report for This Property
The Home Valuation Report is an in-depth analysis detailing your home's value as well as a comparison with similar homes in the area
Home Values in the Area
Average Home Value in this Area
Purchase History
| Date | Buyer | Sale Price | Title Company |
|---|---|---|---|
| Milone Clapp Kerry | -- | None Available | |
| Rosequist Sharon | -- | -- |
Source: Public Records
Tax History
| Year | Tax Paid | Tax Assessment Tax Assessment Total Assessment is a certain percentage of the fair market value that is determined by local assessors to be the total taxable value of land and additions on the property. | Land | Improvement |
|---|---|---|---|---|
| 2025 | $8,184 | $239,500 | $107,300 | $132,200 |
| 2024 | $8,256 | $239,500 | $107,300 | $132,200 |
| 2023 | $8,256 | $239,500 | $107,300 | $132,200 |
| 2022 | $7,480 | $239,500 | $107,300 | $132,200 |
| 2021 | $7,480 | $239,500 | $107,300 | $132,200 |
| 2020 | $8,376 | $272,300 | $154,000 | $118,300 |
| 2019 | $7,973 | $272,300 | $154,000 | $118,300 |
| 2018 | $7,496 | $272,300 | $154,000 | $118,300 |
| 2017 | $7,202 | $272,300 | $154,000 | $118,300 |
| 2016 | $7,006 | $272,300 | $154,000 | $118,300 |
| 2015 | $6,750 | $272,300 | $154,000 | $118,300 |
| 2014 | $6,456 | $272,300 | $154,000 | $118,300 |
Source: Public Records
Map
Nearby Homes
- 35 Hillside Ave
- 79 Main St
- 74 Main St
- 16-18 King St
- 8 Silas Rd
- 4 Elizabeth Ave
- 7 Walton Place
- 2 Roberts Place
- 8 Hillside Ave
- 0 Lawrence Ave
- 64 Spino Dr
- 9 Spino Dr
- 0 Swayze Pl Lawrence Ave
- 8 Spencer St
- 37 Fox Chase Ln
- 1 Smith St
- 329 Alpine Ct Unit 29
- 573 Dell Place Unit 73
- 579 Dell Place Unit 79
- 413 Wills Ave
- 10 Allen Terrace
- 6 Allen Terrace
- 12 Allen Terrace
- 4 Allen Terrace
- 9 College Rd
- 14 Allen Terrace
- 11 College Rd
- 7 College Rd
- 15 College Rd
- 16 Allen Terrace
- 9 Allen Terrace
- 5 College Rd
- 11 Allen Terrace
- 39 Ledgewood Ave
- 13 Allen Terrace
- 15 Allen Terrace
- 2 Allen Terrace
- 18 Allen Terrace
- 5 Stoll St
- 17 Allen Terrace
Your Personal Tour Guide
Ask me questions while you tour the home.