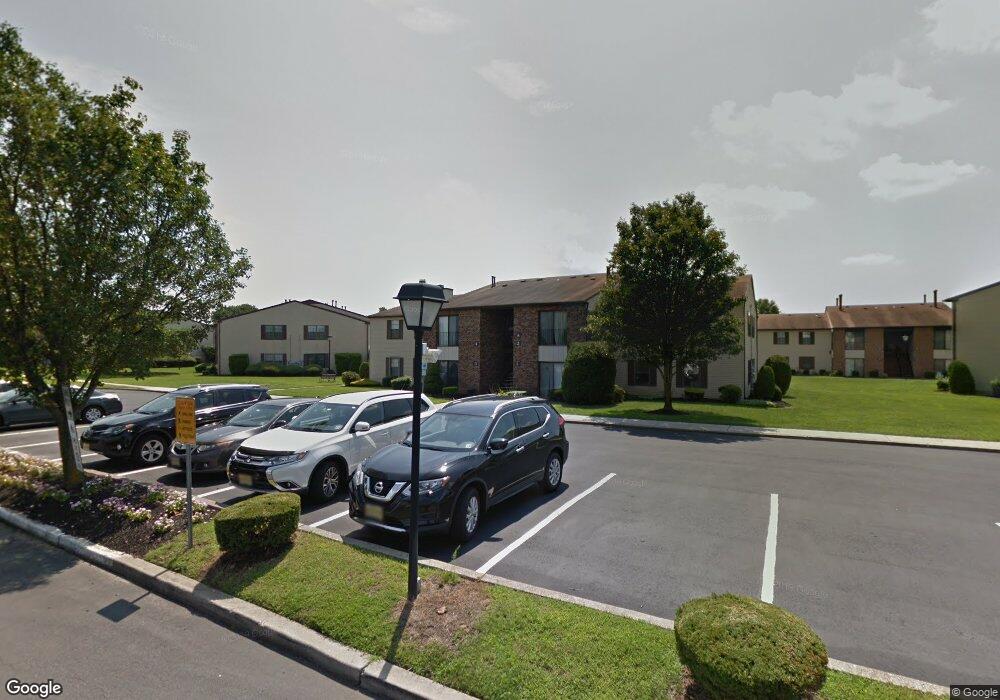
8 Allison Place Unit A18 Sewell, NJ 08080
Washington Township NeighborhoodEstimated Value: $222,520 - $245,000
--
Bed
--
Bath
1,180
Sq Ft
$201/Sq Ft
Est. Value
About This Home
This home is located at 8 Allison Place Unit A18, Sewell, NJ 08080 and is currently estimated at $236,880, approximately $200 per square foot. 8 Allison Place Unit A18 is a home located in Gloucester County with nearby schools including Washington Township High School, Bells Elementary School, and Orchard Valley Middle School.
Ownership History
Date
Name
Owned For
Owner Type
Purchase Details
Closed on
Dec 9, 2002
Sold by
Chappius Brian K and Chappius Kim N
Bought by
Neilio Angela R
Current Estimated Value
Home Financials for this Owner
Home Financials are based on the most recent Mortgage that was taken out on this home.
Original Mortgage
$85,800
Outstanding Balance
$36,669
Interest Rate
6.17%
Mortgage Type
FHA
Estimated Equity
$200,211
Purchase Details
Closed on
Apr 20, 2000
Sold by
Kilpatrick Dr Kathy P
Bought by
Chappius Brian K and Hutchinson Kim M
Home Financials for this Owner
Home Financials are based on the most recent Mortgage that was taken out on this home.
Original Mortgage
$65,490
Interest Rate
8.23%
Mortgage Type
FHA
Purchase Details
Closed on
Aug 23, 1996
Sold by
Simmons Leonard and Simmons Helen
Bought by
Kilpatrick Kathy P
Home Financials for this Owner
Home Financials are based on the most recent Mortgage that was taken out on this home.
Original Mortgage
$62,050
Interest Rate
8.4%
Mortgage Type
FHA
Purchase Details
Closed on
May 29, 1996
Sold by
Hud
Bought by
Simmons Leonard and Simmons Helen
Create a Home Valuation Report for This Property
The Home Valuation Report is an in-depth analysis detailing your home's value as well as a comparison with similar homes in the area
Home Values in the Area
Average Home Value in this Area
Purchase History
| Date | Buyer | Sale Price | Title Company |
|---|---|---|---|
| Neilio Angela R | $87,800 | Congress | |
| Chappius Brian K | $67,000 | Federation Title Agency Inc | |
| Kilpatrick Kathy P | $63,500 | Sentry Land Title Agency Inc | |
| Simmons Leonard | $50,153 | Medford Title Agency Inc |
Source: Public Records
Mortgage History
| Date | Status | Borrower | Loan Amount |
|---|---|---|---|
| Open | Neilio Angela R | $85,800 | |
| Previous Owner | Chappius Brian K | $65,490 | |
| Previous Owner | Kilpatrick Kathy P | $62,050 |
Source: Public Records
Tax History Compared to Growth
Tax History
| Year | Tax Paid | Tax Assessment Tax Assessment Total Assessment is a certain percentage of the fair market value that is determined by local assessors to be the total taxable value of land and additions on the property. | Land | Improvement |
|---|---|---|---|---|
| 2025 | $3,902 | $105,500 | $30,000 | $75,500 |
| 2024 | $3,793 | $105,500 | $30,000 | $75,500 |
| 2023 | $3,793 | $105,500 | $30,000 | $75,500 |
| 2022 | $3,668 | $105,500 | $30,000 | $75,500 |
| 2021 | $2,703 | $105,500 | $30,000 | $75,500 |
| 2020 | $3,567 | $105,500 | $30,000 | $75,500 |
| 2019 | $3,506 | $96,200 | $30,000 | $66,200 |
| 2018 | $3,467 | $96,200 | $30,000 | $66,200 |
| 2017 | $3,424 | $96,200 | $30,000 | $66,200 |
| 2016 | $3,665 | $103,600 | $30,000 | $73,600 |
| 2015 | $3,614 | $103,600 | $30,000 | $73,600 |
| 2014 | $3,500 | $103,600 | $30,000 | $73,600 |
Source: Public Records
Map
Nearby Homes
- 18 Brighton Place
- 5 Kent Place
- 13 Camelot Place
- 15 Ipswich Place Unit BUILDING N
- 3 Windsor Ct Unit D3
- 1 Windsor Ct Unit D1
- 19 Canterbury Ct
- 31 Windsor Ct
- 8 Michele Ct
- 50 Fomalhaut Ave
- 8 Charles Carroll Bldg
- 14 Benner Rd
- 7 John Hancock Bldg Unit 7
- 8 John Hancock Bldg Unit 8
- 1755 Congress Dr
- 4 Corvas Ct
- 1 Matthew Thornton Bldg
- 9 Samuel Adams Bldg
- 19 Ptolemy Ct
- 602 Hurffville Crosskeys Rd
- 4 Allison Place
- 6 Allison Place Unit A7
- 3 Allison Place
- 2 Allison Place
- 5 Allison Place
- 13 Brighton Place Unit C5
- 1 Allison Place
- 14 Brighton Place Unit C7
- 15 Brighton Place Unit C1
- 11 Brighton Place
- 23 Brighton Place Unit D1
- 16 Brighton Place Unit C3
- 24 Brighton Place Unit D3
- 17 Brighton Place
- 12 Brighton Place Unit C8
- 9 Brighton Place Unit C2
- 10 Brighton Place Unit C4
- 31 Uxbridge Place
- 15 Uxbridge Place
- 32 Uxbridge Place Unit U3