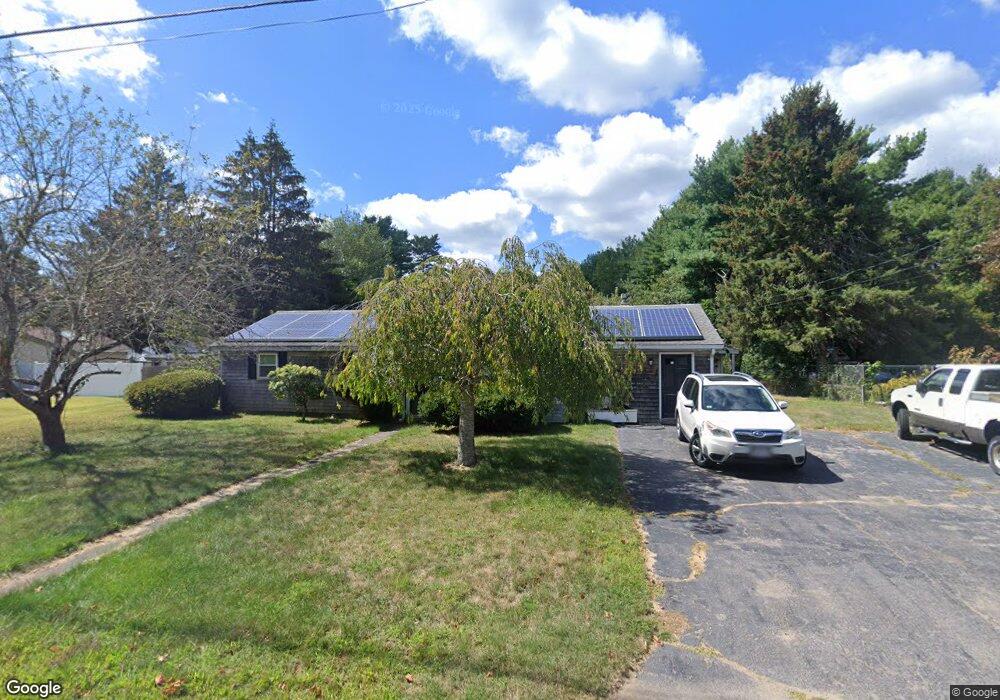
8 Andre Ave East Freetown, MA 02717
Estimated Value: $515,000 - $544,000
3
Beds
3
Baths
2,000
Sq Ft
$266/Sq Ft
Est. Value
About This Home
This home is located at 8 Andre Ave, East Freetown, MA 02717 and is currently estimated at $531,419, approximately $265 per square foot. 8 Andre Ave is a home located in Bristol County with nearby schools including Freetown Elementary School, George R Austin Intermediate School, and Freetown-Lakeville Middle School.
Ownership History
Date
Name
Owned For
Owner Type
Purchase Details
Closed on
Dec 1, 1995
Sold by
Zexter Barbara Lee
Bought by
Scott Diane E
Current Estimated Value
Home Financials for this Owner
Home Financials are based on the most recent Mortgage that was taken out on this home.
Original Mortgage
$90,800
Interest Rate
7.37%
Mortgage Type
Purchase Money Mortgage
Create a Home Valuation Report for This Property
The Home Valuation Report is an in-depth analysis detailing your home's value as well as a comparison with similar homes in the area
Home Values in the Area
Average Home Value in this Area
Purchase History
| Date | Buyer | Sale Price | Title Company |
|---|---|---|---|
| Scott Diane E | $113,500 | -- |
Source: Public Records
Mortgage History
| Date | Status | Borrower | Loan Amount |
|---|---|---|---|
| Open | Scott Diane E | $50,000 | |
| Open | Scott Diane E | $116,727 | |
| Closed | Scott Diane E | $120,000 | |
| Closed | Scott Diane E | $90,800 |
Source: Public Records
Tax History Compared to Growth
Tax History
| Year | Tax Paid | Tax Assessment Tax Assessment Total Assessment is a certain percentage of the fair market value that is determined by local assessors to be the total taxable value of land and additions on the property. | Land | Improvement |
|---|---|---|---|---|
| 2025 | $4,138 | $417,600 | $172,500 | $245,100 |
| 2024 | $4,109 | $394,000 | $162,700 | $231,300 |
| 2023 | $4,046 | $377,800 | $146,500 | $231,300 |
| 2022 | $3,854 | $319,600 | $124,100 | $195,500 |
| 2021 | $4,382 | $291,000 | $112,900 | $178,100 |
| 2020 | $3,876 | $281,200 | $108,600 | $172,600 |
| 2019 | $3,491 | $265,500 | $103,400 | $162,100 |
| 2018 | $3,308 | $248,500 | $103,400 | $145,100 |
| 2017 | $3,247 | $243,800 | $103,400 | $140,400 |
| 2016 | $3,098 | $236,700 | $100,400 | $136,300 |
| 2015 | $3,044 | $236,000 | $100,400 | $135,600 |
| 2014 | $2,475 | $196,300 | $98,300 | $98,000 |
Source: Public Records
Map
Nearby Homes