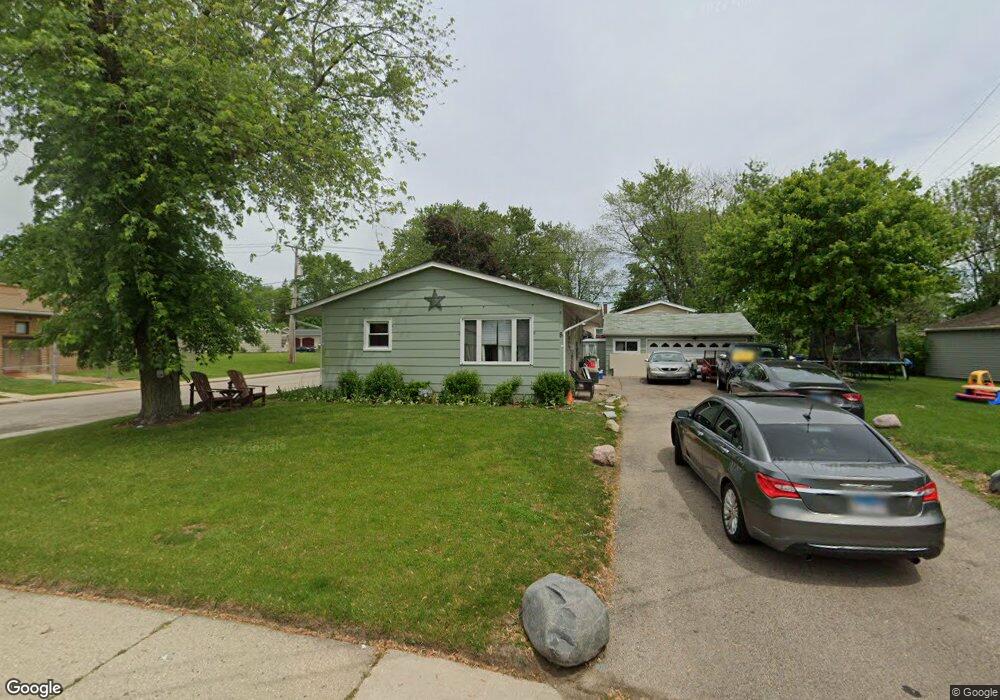
8 Austin Ave Carpentersville, IL 60110
Estimated Value: $279,701 - $292,000
3
Beds
1
Bath
1,260
Sq Ft
$227/Sq Ft
Est. Value
About This Home
This home is located at 8 Austin Ave, Carpentersville, IL 60110 and is currently estimated at $285,925, approximately $226 per square foot. 8 Austin Ave is a home located in Kane County with nearby schools including Lakewood School, Crescent City Grade School, and Carpentersville Middle School.
Ownership History
Date
Name
Owned For
Owner Type
Purchase Details
Closed on
Nov 16, 2021
Sold by
Vasquez Ismael and Vasquez Ismael
Bought by
Vasquez Ismael
Current Estimated Value
Home Financials for this Owner
Home Financials are based on the most recent Mortgage that was taken out on this home.
Original Mortgage
$152,600
Outstanding Balance
$140,796
Interest Rate
3.5%
Mortgage Type
New Conventional
Estimated Equity
$145,129
Purchase Details
Closed on
Feb 22, 2017
Sold by
Farrell John P
Bought by
Vazquez Ismael
Home Financials for this Owner
Home Financials are based on the most recent Mortgage that was taken out on this home.
Original Mortgage
$149,246
Interest Rate
4.37%
Mortgage Type
FHA
Purchase Details
Closed on
Jul 12, 2014
Sold by
Farrell Maureen B and Farrell Jerome T
Bought by
Farrell John P
Purchase Details
Closed on
Jul 11, 2014
Sold by
Farrell Maureen B
Bought by
Farrell John P and Farrell Maureen B
Create a Home Valuation Report for This Property
The Home Valuation Report is an in-depth analysis detailing your home's value as well as a comparison with similar homes in the area
Home Values in the Area
Average Home Value in this Area
Purchase History
| Date | Buyer | Sale Price | Title Company |
|---|---|---|---|
| Vasquez Ismael | -- | First American Title | |
| Vazquez Ismael | $152,000 | Fidelity National Title | |
| Farrell John P | -- | None Available | |
| Farrell John P | -- | None Available |
Source: Public Records
Mortgage History
| Date | Status | Borrower | Loan Amount |
|---|---|---|---|
| Open | Vasquez Ismael | $152,600 | |
| Closed | Vazquez Ismael | $149,246 |
Source: Public Records
Tax History Compared to Growth
Tax History
| Year | Tax Paid | Tax Assessment Tax Assessment Total Assessment is a certain percentage of the fair market value that is determined by local assessors to be the total taxable value of land and additions on the property. | Land | Improvement |
|---|---|---|---|---|
| 2024 | $5,019 | $74,268 | $12,553 | $61,715 |
| 2023 | $4,943 | $66,824 | $11,295 | $55,529 |
| 2022 | $4,516 | $57,862 | $11,295 | $46,567 |
| 2021 | $4,406 | $54,633 | $10,665 | $43,968 |
| 2020 | $4,330 | $53,404 | $10,425 | $42,979 |
| 2019 | $4,229 | $50,697 | $9,897 | $40,800 |
| 2018 | $3,927 | $45,569 | $9,701 | $35,868 |
| 2017 | $3,757 | $42,628 | $9,075 | $33,553 |
| 2016 | $3,364 | $36,578 | $8,787 | $27,791 |
| 2015 | -- | $28,436 | $8,234 | $20,202 |
| 2014 | -- | $25,546 | $8,007 | $17,539 |
| 2013 | -- | $26,328 | $8,252 | $18,076 |
Source: Public Records
Map
Nearby Homes
- 7 Austin Ave
- 4 Austin Ave
- 327 Tulsa Ave
- 157 Austin Ave
- 149 Austin Ave
- 181 Skyline Dr
- 57 Robin Rd
- 7 Hickory Dr
- 1317 Brookdale Dr
- 1040 Rosewood Dr
- 103 Hickory Dr
- 171 Lake Shore Dr
- 135 Indian Ln
- 1244 Brookdale Dr
- 1426 Kings Rd
- 140 Hickory Dr
- 494 Rosewood Dr
- 1017 Brookdale Dr Unit 1017
- 105 Siesta Rd
- 1203 Brookdale Dr
- 6 Austin Ave
- 1601 Sacramento Dr
- 927 Berkley St
- 925 Berkley St
- 933 Berkley St
- 1606 Sacramento Dr
- 1603 Sacramento Dr
- 923 Berkley St
- 14 Austin Ave
- 13 Austin Ave
- 935 Berkley St
- 1605 Sacramento Dr
- 921 Berkley St
- 602 Topeka Dr
- 1608 Sacramento Dr
- 937 Berkley St
- 601 Topeka Dr
- 16 Austin Ave
- 1607 Sacramento Dr