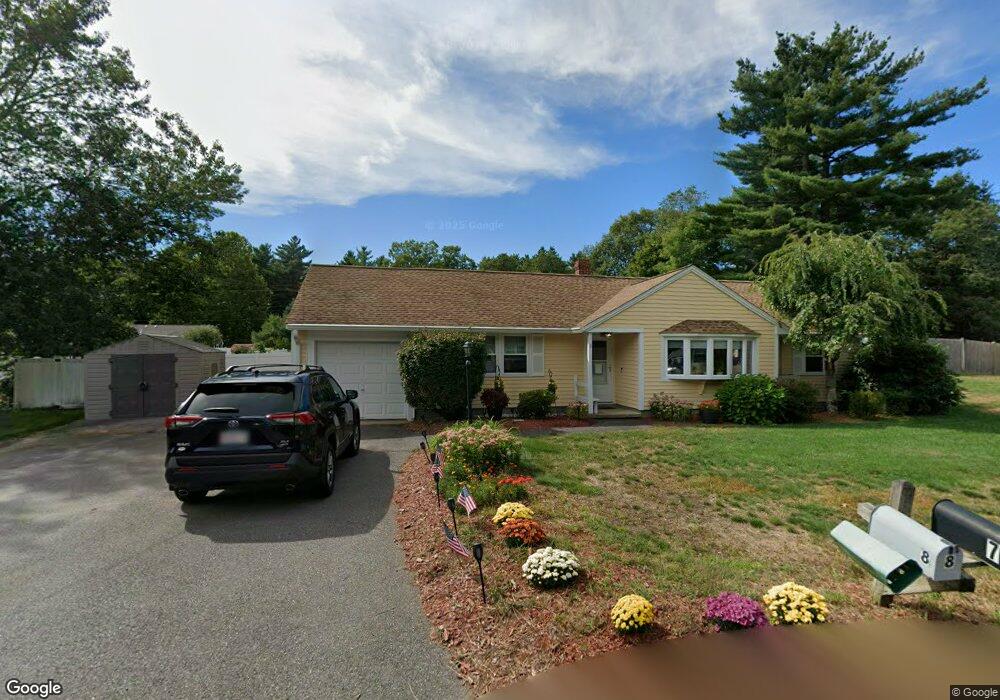
8 Bacon St Pepperell, MA 01463
Estimated Value: $480,186 - $506,000
4
Beds
2
Baths
1,737
Sq Ft
$285/Sq Ft
Est. Value
About This Home
This home is located at 8 Bacon St, Pepperell, MA 01463 and is currently estimated at $495,297, approximately $285 per square foot. 8 Bacon St is a home located in Middlesex County with nearby schools including North Middlesex Regional High School, Pepperell Christian Academy, and Maple Dene & Moppet School.
Ownership History
Date
Name
Owned For
Owner Type
Purchase Details
Closed on
Oct 1, 2020
Sold by
Bourassa Richard D and Bourassa Maria C
Bought by
Bourassa 2020 T
Current Estimated Value
Create a Home Valuation Report for This Property
The Home Valuation Report is an in-depth analysis detailing your home's value as well as a comparison with similar homes in the area
Home Values in the Area
Average Home Value in this Area
Purchase History
| Date | Buyer | Sale Price | Title Company |
|---|---|---|---|
| Bourassa 2020 T | -- | None Available |
Source: Public Records
Tax History
| Year | Tax Paid | Tax Assessment Tax Assessment Total Assessment is a certain percentage of the fair market value that is determined by local assessors to be the total taxable value of land and additions on the property. | Land | Improvement |
|---|---|---|---|---|
| 2025 | $5,358 | $366,200 | $127,400 | $238,800 |
| 2024 | $4,991 | $347,800 | $115,300 | $232,500 |
| 2023 | $5,164 | $341,100 | $115,300 | $225,800 |
| 2022 | $4,757 | $277,400 | $91,000 | $186,400 |
| 2021 | $4,555 | $254,200 | $78,900 | $175,300 |
| 2020 | $4,277 | $251,900 | $78,900 | $173,000 |
| 2019 | $3,922 | $236,400 | $78,900 | $157,500 |
| 2018 | $5,920 | $223,200 | $78,900 | $144,300 |
| 2017 | $3,423 | $215,400 | $78,900 | $136,500 |
| 2016 | $3,035 | $183,600 | $78,900 | $104,700 |
| 2015 | $2,868 | $179,800 | $78,900 | $100,900 |
| 2014 | $2,723 | $171,700 | $78,900 | $92,800 |
Source: Public Records
Map
Nearby Homes
- 208 North St
- 179 Wyman Rd
- 235 Kemp St
- 11 Unkety Brook Way
- 12 Unkety Brook Way
- 27 Merrimac Dr
- 38 Tarbell St Unit 5B
- 38 Tarbell St Unit 1D
- 29 Tarbell St
- 114 Groton St
- 8 Casie Ln
- 28-30 Groton St
- 10 Bennett St
- 200 Nashua Rd
- 113-115 Main St
- 39 Hollis St Unit A
- 53 Mclains Woods Rd
- 319 Pleasant St
- 147 Nashua Rd
- 38 River Rd Unit 11
Your Personal Tour Guide
Ask me questions while you tour the home.