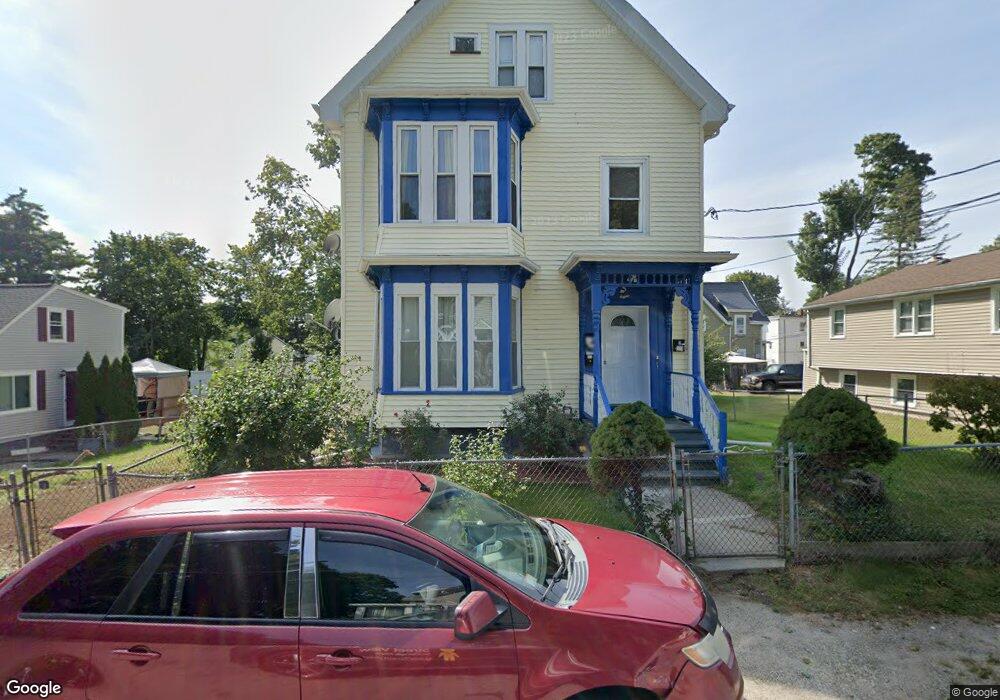
8 Beach St Brockton, MA 02302
Campello NeighborhoodEstimated Value: $652,540 - $771,000
5
Beds
3
Baths
2,343
Sq Ft
$305/Sq Ft
Est. Value
About This Home
This home is located at 8 Beach St, Brockton, MA 02302 and is currently estimated at $715,385, approximately $305 per square foot. 8 Beach St is a home located in Plymouth County with nearby schools including Gilmore Elementary School, Davis K-8 School, and John F. Kennedy Elementary School.
Ownership History
Date
Name
Owned For
Owner Type
Purchase Details
Closed on
Sep 29, 2003
Sold by
Jones Ft
Bought by
Hope Green Kenroy and Hope Anthony
Current Estimated Value
Home Financials for this Owner
Home Financials are based on the most recent Mortgage that was taken out on this home.
Original Mortgage
$342,562
Outstanding Balance
$160,737
Interest Rate
6.29%
Mortgage Type
Purchase Money Mortgage
Estimated Equity
$554,649
Create a Home Valuation Report for This Property
The Home Valuation Report is an in-depth analysis detailing your home's value as well as a comparison with similar homes in the area
Home Values in the Area
Average Home Value in this Area
Purchase History
We collect this data history from publicly available records. To have your information removed, we recommend requesting removal directly through your county’s website.
| Date | Buyer | Sale Price | Title Company |
|---|---|---|---|
| Hope Green Kenroy | $348,000 | -- |
Source: Public Records
Mortgage History
We collect this data history from publicly available records. To have your information removed, we recommend requesting removal directly through your county’s website.
| Date | Status | Borrower | Loan Amount |
|---|---|---|---|
| Open | Hope Green Kenroy | $50,451 | |
| Open | Hope Green Kenroy | $342,562 | |
| Previous Owner | Hope Green Kenroy | $100,000 | |
| Previous Owner | Hope Green Kenroy | $7,500 |
Source: Public Records
Tax History
| Year | Tax Paid | Tax Assessment Tax Assessment Total Assessment is a certain percentage of the fair market value that is determined by local assessors to be the total taxable value of land and additions on the property. | Land | Improvement |
|---|---|---|---|---|
| 2025 | $7,638 | $630,700 | $157,600 | $473,100 |
| 2024 | $7,088 | $589,700 | $157,600 | $432,100 |
| 2023 | $6,477 | $499,000 | $107,700 | $391,300 |
| 2022 | $6,119 | $438,000 | $97,900 | $340,100 |
| 2021 | $6,126 | $422,500 | $90,100 | $332,400 |
| 2020 | $5,240 | $345,900 | $79,400 | $266,500 |
| 2019 | $5,001 | $321,800 | $75,500 | $246,300 |
| 2018 | $5,517 | $343,500 | $75,500 | $268,000 |
| 2017 | $4,658 | $289,300 | $75,500 | $213,800 |
| 2016 | $3,758 | $216,500 | $72,000 | $144,500 |
| 2015 | $3,071 | $169,200 | $72,000 | $97,200 |
| 2014 | $3,153 | $173,900 | $72,000 | $101,900 |
Source: Public Records
Map
Nearby Homes
- 8 Beach St Unit 1
- 8 Beach St Unit 2
- 125 Riverview St
- 6 Beach St
- 123 Riverview St
- 123 Riverview St Unit 1
- 123 Riverview St Unit 2
- 131 Riverview St
- 131 Riverview St Unit 1
- 13 Beach St
- 53 Hillside Ave
- 126 Riverview St
- 126 Riverview St Unit 2
- 133 Riverview St
- 47 Hillside Ave
- 65 Hillside Ave
- 113 Riverview St
- 111 Riverview St
- 141 Riverview St
- 124 Riverview St
Your Personal Tour Guide
Ask me questions while you tour the home.