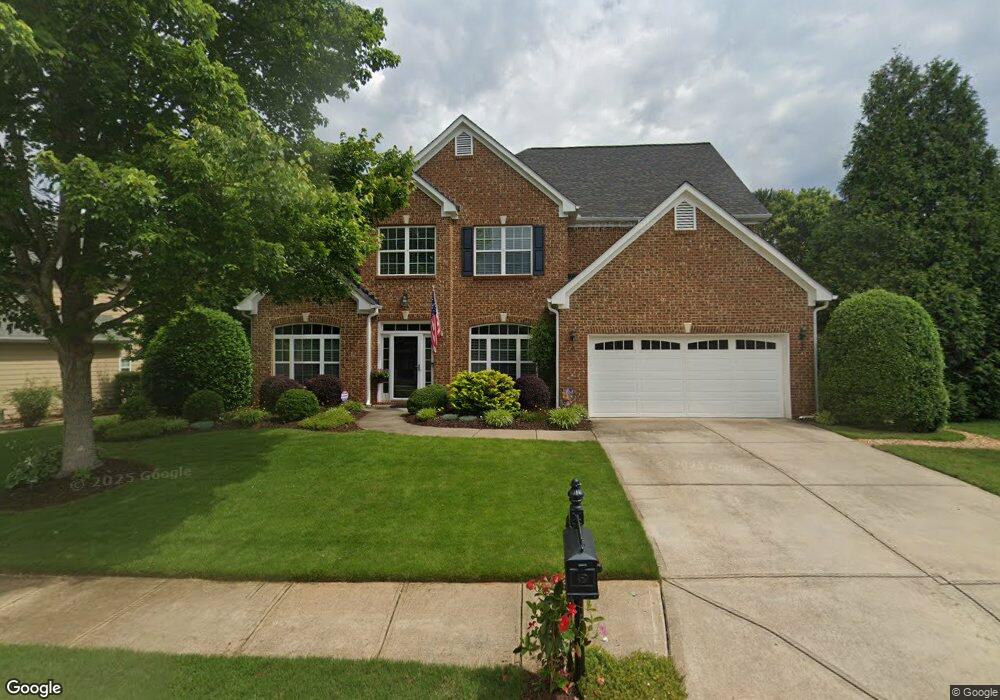
8 Boulder Bend Newnan, GA 30265
Estimated Value: $437,075 - $497,000
5
Beds
3
Baths
3,119
Sq Ft
$150/Sq Ft
Est. Value
About This Home
This home is located at 8 Boulder Bend, Newnan, GA 30265 and is currently estimated at $468,519, approximately $150 per square foot. 8 Boulder Bend is a home located in Coweta County with nearby schools including Newnan Crossing Elementary School, Arnall Middle School, and East Coweta High School.
Ownership History
Date
Name
Owned For
Owner Type
Purchase Details
Closed on
May 29, 2009
Sold by
Patrick Malloy Communities Llc
Bought by
Stone Thomas and Stone Joanne
Current Estimated Value
Purchase Details
Closed on
Sep 25, 2008
Sold by
Stonebridge Of Newnan Crossing
Bought by
Patrick Malloy Communities Llc
Home Financials for this Owner
Home Financials are based on the most recent Mortgage that was taken out on this home.
Original Mortgage
$187,500
Interest Rate
6.45%
Purchase Details
Closed on
Jun 19, 2003
Sold by
Newnan Crossing Partnersh
Bought by
Stonebridge At Newnan Crossing Llc
Purchase Details
Closed on
Apr 4, 2001
Sold by
Lewisphthe Salvation Army
Bought by
Newnan Crossing Partnersh
Purchase Details
Closed on
Apr 17, 1989
Bought by
Newnan Crossing Part
Purchase Details
Closed on
Apr 5, 1989
Bought by
Signa Development Co
Create a Home Valuation Report for This Property
The Home Valuation Report is an in-depth analysis detailing your home's value as well as a comparison with similar homes in the area
Purchase History
| Date | Buyer | Sale Price | Title Company |
|---|---|---|---|
| Stone Thomas | $223,700 | -- | |
| Patrick Malloy Communities Llc | $55,000 | -- | |
| Stonebridge At Newnan Crossing Llc | $6,921,900 | -- | |
| Newnan Crossing Partnersh | -- | -- | |
| Newnan Crossing Part | -- | -- | |
| Signa Development Co | -- | -- |
Source: Public Records
Mortgage History
| Date | Status | Borrower | Loan Amount |
|---|---|---|---|
| Previous Owner | Patrick Malloy Communities Llc | $187,500 |
Source: Public Records
Tax History
| Year | Tax Paid | Tax Assessment Tax Assessment Total Assessment is a certain percentage of the fair market value that is determined by local assessors to be the total taxable value of land and additions on the property. | Land | Improvement |
|---|---|---|---|---|
| 2025 | $2,951 | $183,193 | $30,000 | $153,193 |
| 2024 | $2,924 | $170,466 | $30,000 | $140,466 |
| 2023 | $2,924 | $176,683 | $26,000 | $150,683 |
Source: Public Records
Map
Nearby Homes
- 246 Bridgewater Ln
- 131 Bridgewater Ln
- 200 Valley Brook Dr
- 18 Stone Ct
- 80 Creekside Way
- 20 Bryce Creek Dr
- 9 Ravine Dr
- 93 Greentree Dr
- 35 Canyon View Dr
- 37 Greentree Dr
- 146 Greentree Dr
- 186 Granite Way
- 115 Courtyard Ln
- 301 Daybreak Ln
- 112 Granite Way
- 22 Barberry Dr
- 1903 Daybreak Ln
- 313 Daybreak Ln
- 305 Daybreak Ln
- 311 Daybreak Ln
- 12 Boulder Bend
- 99 Stonebridge Blvd
- 7 Pillar Point Unit 595
- 7 Pillar Point
- 3 Pillar Point Unit 594
- 11 Pillar Point Unit 596
- 16 Boulder Bend
- 11 Boulder Bend
- 11 Boulder Bend Unit 576
- 7 Boulder Bend
- 7 Boulder Bend Unit 575
- 15 Boulder Bend
- 3 Boulder Bend
- 17 Boulder Bend
- 17 Boulder Bend Unit 578
- 22 Boulder Bend
- 15 Pillar Point Unit 597
- 15 Pillar Point
- 104 Stonebridge Blvd Unit 612
- 100 Stonebridge Blvd Unit 611
Your Personal Tour Guide
Ask me questions while you tour the home.