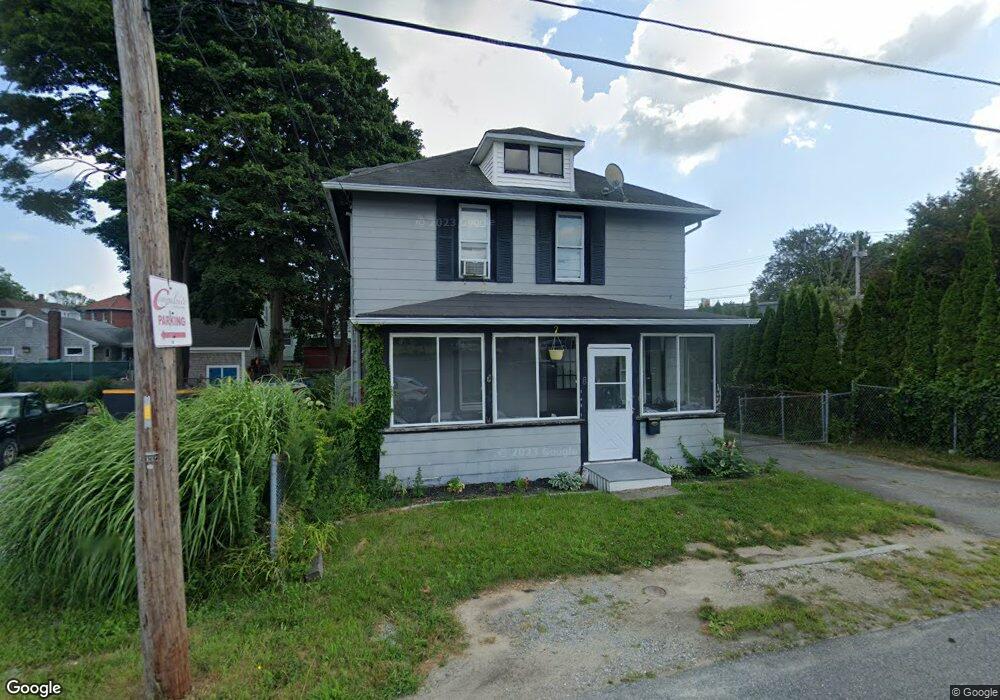
8 Boylston St Acushnet, MA 02743
Upper Acushnet NeighborhoodEstimated Value: $343,301 - $404,000
Studio
1
Bath
1,248
Sq Ft
$300/Sq Ft
Est. Value
About This Home
This home is located at 8 Boylston St, Acushnet, MA 02743 and is currently estimated at $374,575, approximately $300 per square foot. 8 Boylston St is a home located in Bristol County with nearby schools including Acushnet Elementary School, Albert F Ford Middle School, and Alma Del Mar Charter School.
Ownership History
Date
Name
Owned For
Owner Type
Purchase Details
Closed on
Oct 8, 2009
Sold by
Deutsche Bank Natl T C
Bought by
Jose Tiffany S
Current Estimated Value
Home Financials for this Owner
Home Financials are based on the most recent Mortgage that was taken out on this home.
Original Mortgage
$145,319
Outstanding Balance
$95,181
Interest Rate
5.14%
Mortgage Type
Purchase Money Mortgage
Estimated Equity
$279,394
Purchase Details
Closed on
May 19, 2009
Sold by
Andrews Christine and American Home Mtg Svcs
Bought by
Deutsche Bank Natl T C
Purchase Details
Closed on
Aug 11, 2003
Sold by
Andrews Christine and Stephens Christine
Bought by
Andrews Christine
Create a Home Valuation Report for This Property
The Home Valuation Report is an in-depth analysis detailing your home's value as well as a comparison with similar homes in the area
Home Values in the Area
Average Home Value in this Area
Purchase History
| Date | Buyer | Sale Price | Title Company |
|---|---|---|---|
| Jose Tiffany S | $148,000 | -- | |
| Deutsche Bank Natl T C | $131,250 | -- | |
| Andrews Christine | -- | -- |
Source: Public Records
Mortgage History
| Date | Status | Borrower | Loan Amount |
|---|---|---|---|
| Open | Andrews Christine | $145,319 | |
| Previous Owner | Andrews Christine | $160,000 |
Source: Public Records
Tax History
| Year | Tax Paid | Tax Assessment Tax Assessment Total Assessment is a certain percentage of the fair market value that is determined by local assessors to be the total taxable value of land and additions on the property. | Land | Improvement |
|---|---|---|---|---|
| 2025 | $33 | $301,900 | $86,600 | $215,300 |
| 2024 | $3,110 | $272,600 | $82,500 | $190,100 |
| 2023 | $3,059 | $254,900 | $74,500 | $180,400 |
| 2022 | $2,854 | $215,100 | $70,500 | $144,600 |
| 2021 | $2,805 | $202,800 | $70,500 | $132,300 |
| 2020 | $2,827 | $202,800 | $70,500 | $132,300 |
| 2019 | $2,659 | $187,500 | $62,400 | $125,100 |
| 2018 | $2,567 | $178,000 | $62,400 | $115,600 |
| 2017 | $2,465 | $170,700 | $62,400 | $108,300 |
| 2016 | $2,306 | $158,700 | $62,400 | $96,300 |
| 2015 | $2,266 | $158,700 | $62,400 | $96,300 |
Source: Public Records
Map
Nearby Homes
Your Personal Tour Guide
Ask me questions while you tour the home.