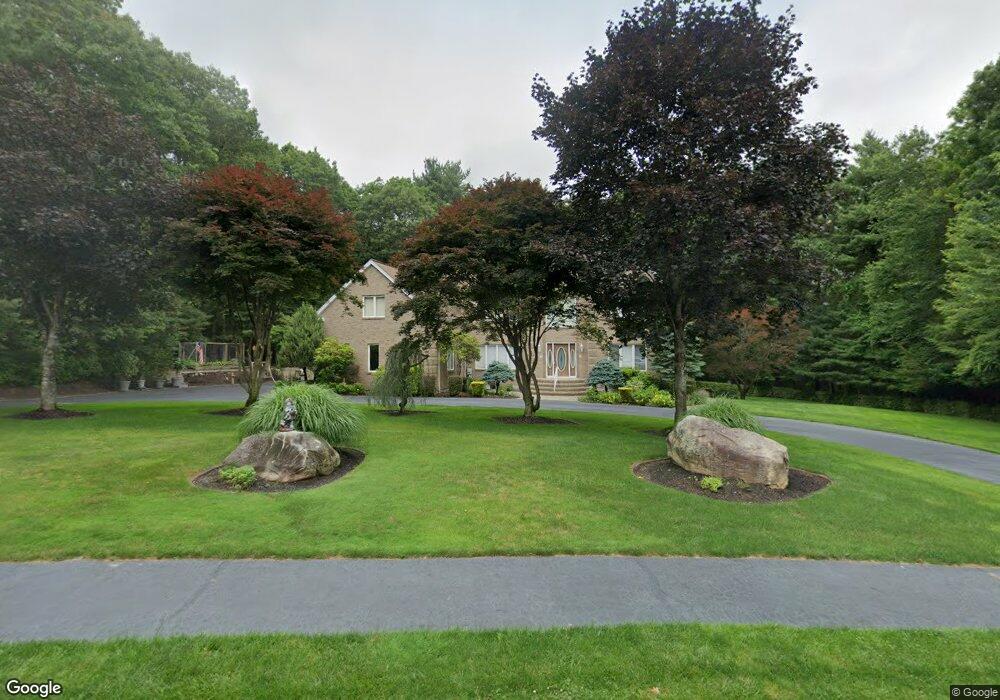
8 Bridle Path Walpole, MA 02081
Estimated Value: $1,332,000 - $1,592,000
4
Beds
4
Baths
4,034
Sq Ft
$354/Sq Ft
Est. Value
About This Home
This home is located at 8 Bridle Path, Walpole, MA 02081 and is currently estimated at $1,427,657, approximately $353 per square foot. 8 Bridle Path is a home located in Norfolk County with nearby schools including Fisher School, Walpole Middle School, and Walpole High School.
Ownership History
Date
Name
Owned For
Owner Type
Purchase Details
Closed on
Jan 29, 2016
Sold by
Compagnone Domenico R and Compagnone Anna M
Bought by
Compagnone Rt and Compagnone Domenico R
Current Estimated Value
Purchase Details
Closed on
Jun 18, 2014
Sold by
Glaropoulos Demetrios and Glaropoulos Maria
Bought by
Glaropoulos Demetrios
Home Financials for this Owner
Home Financials are based on the most recent Mortgage that was taken out on this home.
Original Mortgage
$400,000
Interest Rate
3%
Mortgage Type
Adjustable Rate Mortgage/ARM
Create a Home Valuation Report for This Property
The Home Valuation Report is an in-depth analysis detailing your home's value as well as a comparison with similar homes in the area
Home Values in the Area
Average Home Value in this Area
Purchase History
| Date | Buyer | Sale Price | Title Company |
|---|---|---|---|
| Compagnone Rt | -- | -- | |
| Glaropoulos Demetrios | -- | -- |
Source: Public Records
Mortgage History
| Date | Status | Borrower | Loan Amount |
|---|---|---|---|
| Previous Owner | Glaropoulos Demetrios | $400,000 |
Source: Public Records
Tax History
| Year | Tax Paid | Tax Assessment Tax Assessment Total Assessment is a certain percentage of the fair market value that is determined by local assessors to be the total taxable value of land and additions on the property. | Land | Improvement |
|---|---|---|---|---|
| 2025 | $17,477 | $1,362,200 | $427,800 | $934,400 |
| 2024 | $16,825 | $1,272,700 | $411,500 | $861,200 |
| 2023 | $15,396 | $1,108,400 | $357,600 | $750,800 |
| 2022 | $14,003 | $968,400 | $331,300 | $637,100 |
| 2021 | $13,798 | $929,800 | $312,700 | $617,100 |
| 2020 | $12,983 | $866,100 | $305,400 | $560,700 |
| 2019 | $12,701 | $841,100 | $293,900 | $547,200 |
| 2018 | $12,986 | $850,400 | $282,400 | $568,000 |
| 2017 | $12,635 | $824,200 | $271,500 | $552,700 |
| 2016 | $12,725 | $817,800 | $290,700 | $527,100 |
| 2015 | $12,547 | $799,200 | $287,300 | $511,900 |
| 2014 | $12,175 | $772,500 | $287,300 | $485,200 |
Source: Public Records
Map
Nearby Homes
Your Personal Tour Guide
Ask me questions while you tour the home.