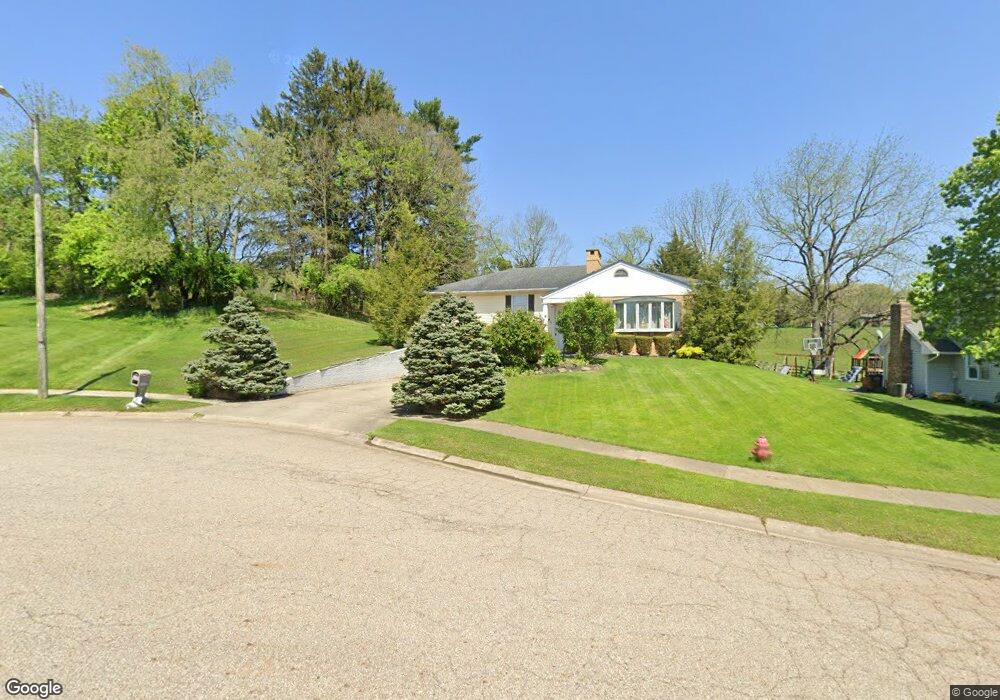
8 Buckingham Ct Mount Vernon, OH 43050
Estimated Value: $321,000 - $409,000
3
Beds
3
Baths
1,848
Sq Ft
$190/Sq Ft
Est. Value
About This Home
This home is located at 8 Buckingham Ct, Mount Vernon, OH 43050 and is currently estimated at $350,584, approximately $189 per square foot. 8 Buckingham Ct is a home located in Knox County with nearby schools including Mount Vernon High School, St. Vincent de Paul School, and Christian Star Academy.
Ownership History
Date
Name
Owned For
Owner Type
Purchase Details
Closed on
May 20, 2005
Sold by
Hitchings Robert L and Hitchings Sharon L
Bought by
Fithian Michael J C and Fithian Joan
Current Estimated Value
Home Financials for this Owner
Home Financials are based on the most recent Mortgage that was taken out on this home.
Original Mortgage
$175,500
Outstanding Balance
$91,918
Interest Rate
5.91%
Mortgage Type
New Conventional
Estimated Equity
$258,666
Purchase Details
Closed on
Dec 9, 2002
Bought by
Hitchings Robert L and Hitchings Shar
Purchase Details
Closed on
Feb 22, 1999
Sold by
Moore Wanda P
Bought by
Moore Wanda Trustee Of Th
Purchase Details
Closed on
Jan 3, 1989
Sold by
Hall James and Hall Dianne M
Bought by
Moore Wanda P
Purchase Details
Closed on
Apr 1, 1988
Bought by
Hall James and Hall Dianne M
Create a Home Valuation Report for This Property
The Home Valuation Report is an in-depth analysis detailing your home's value as well as a comparison with similar homes in the area
Home Values in the Area
Average Home Value in this Area
Purchase History
| Date | Buyer | Sale Price | Title Company |
|---|---|---|---|
| Fithian Michael J C | $146,250 | None Available | |
| Hitchings Robert L | $182,000 | -- | |
| Moore Wanda Trustee Of Th | -- | -- | |
| Moore Wanda P | $93,500 | -- | |
| Hall James | $12,000 | -- |
Source: Public Records
Mortgage History
| Date | Status | Borrower | Loan Amount |
|---|---|---|---|
| Open | Fithian Michael J C | $175,500 |
Source: Public Records
Tax History Compared to Growth
Tax History
| Year | Tax Paid | Tax Assessment Tax Assessment Total Assessment is a certain percentage of the fair market value that is determined by local assessors to be the total taxable value of land and additions on the property. | Land | Improvement |
|---|---|---|---|---|
| 2024 | $4,115 | $106,730 | $11,750 | $94,980 |
| 2023 | $4,115 | $106,730 | $11,750 | $94,980 |
| 2022 | $3,251 | $76,780 | $8,450 | $68,330 |
| 2021 | $3,251 | $76,780 | $8,450 | $68,330 |
| 2020 | $3,166 | $76,780 | $8,450 | $68,330 |
| 2019 | $2,796 | $63,190 | $8,420 | $54,770 |
| 2018 | $2,797 | $63,190 | $8,420 | $54,770 |
| 2017 | $2,746 | $63,190 | $8,420 | $54,770 |
| 2016 | $2,548 | $58,520 | $7,800 | $50,720 |
| 2015 | $2,559 | $58,520 | $7,800 | $50,720 |
| 2014 | $2,572 | $58,520 | $7,800 | $50,720 |
| 2013 | $2,665 | $57,810 | $7,330 | $50,480 |
Source: Public Records
Map
Nearby Homes
- 4 Craig Dr
- 1109 Oak Street Extension
- 1107 Oak Street Extension
- 900 E Gambier St
- 812 Howard St
- 501 Oak St
- 800 E Vine St
- 613 E Gambier St
- 301 Teryl Dr
- 105 N Center St
- 649 Howard St
- 114 Ringold St
- 2 Coventry Ct
- 2 Coventry Ct W
- 200 Eastwood Dr
- 60 Wildwood Ln
- 504 E Chestnut St
- 1575 New Gambier Rd
- 106 N Concord St
- 55 Wildwood Ln