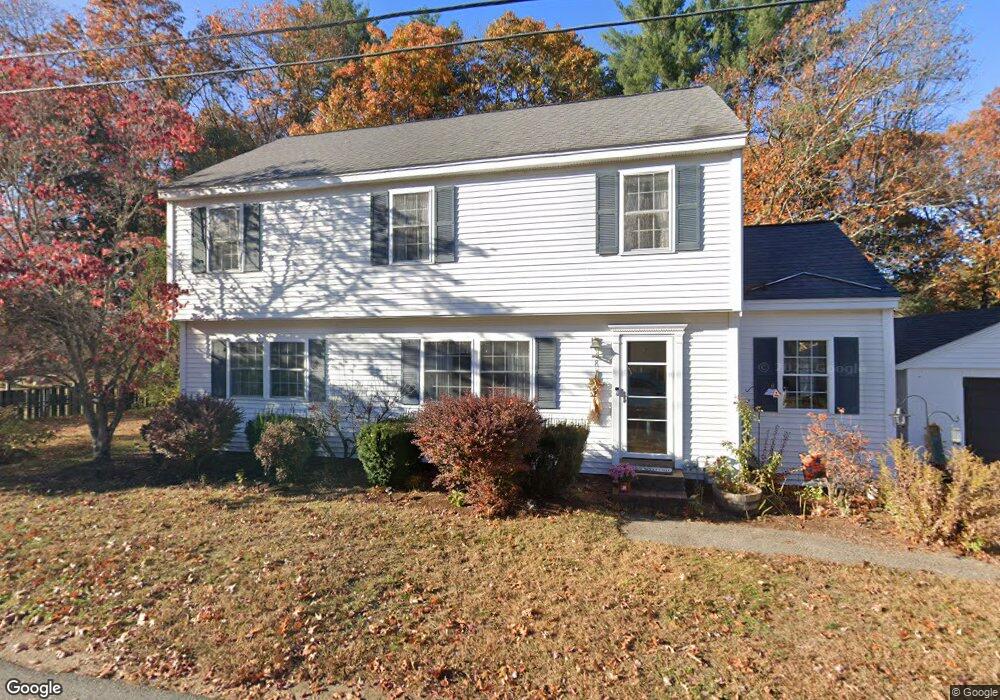
8 Burnside Ln Merrimac, MA 01860
Estimated Value: $611,000 - $641,810
4
Beds
2
Baths
1,764
Sq Ft
$354/Sq Ft
Est. Value
About This Home
This home is located at 8 Burnside Ln, Merrimac, MA 01860 and is currently estimated at $623,953, approximately $353 per square foot. 8 Burnside Ln is a home located in Essex County with nearby schools including Pentucket Regional High School.
Ownership History
Date
Name
Owned For
Owner Type
Purchase Details
Closed on
Mar 6, 2019
Sold by
Baga James D and Baga Nora J
Bought by
Baga Ft and Baga
Current Estimated Value
Purchase Details
Closed on
Jul 15, 1994
Sold by
Liffers Douglas J and Liffers Beth E
Bought by
Baga James D and Baga Nora J
Purchase Details
Closed on
Jun 4, 1990
Sold by
Griesmaye J R Mayfield
Bought by
Liffers Douglas J
Create a Home Valuation Report for This Property
The Home Valuation Report is an in-depth analysis detailing your home's value as well as a comparison with similar homes in the area
Home Values in the Area
Average Home Value in this Area
Purchase History
| Date | Buyer | Sale Price | Title Company |
|---|---|---|---|
| Baga Ft | -- | -- | |
| Baga James D | $105,000 | -- | |
| Liffers Douglas J | $110,000 | -- | |
| Liffers Douglas J | $110,000 | -- |
Source: Public Records
Mortgage History
| Date | Status | Borrower | Loan Amount |
|---|---|---|---|
| Previous Owner | Liffers Douglas J | $238,000 | |
| Previous Owner | Liffers Douglas J | $240,000 |
Source: Public Records
Tax History Compared to Growth
Tax History
| Year | Tax Paid | Tax Assessment Tax Assessment Total Assessment is a certain percentage of the fair market value that is determined by local assessors to be the total taxable value of land and additions on the property. | Land | Improvement |
|---|---|---|---|---|
| 2025 | $7,204 | $543,700 | $289,000 | $254,700 |
| 2024 | $7,310 | $541,500 | $289,000 | $252,500 |
| 2023 | $6,794 | $460,000 | $250,500 | $209,500 |
| 2022 | $6,302 | $385,700 | $208,700 | $177,000 |
| 2021 | $6,287 | $385,700 | $208,700 | $177,000 |
| 2020 | $5,739 | $385,700 | $208,700 | $177,000 |
| 2019 | $5,124 | $324,100 | $154,100 | $170,000 |
| 2018 | $4,800 | $304,600 | $138,100 | $166,500 |
| 2017 | $4,891 | $299,300 | $138,100 | $161,200 |
| 2016 | $4,780 | $295,800 | $138,100 | $157,700 |
| 2015 | $4,613 | $283,900 | $138,100 | $145,800 |
| 2014 | $4,511 | $283,900 | $138,100 | $145,800 |
Source: Public Records
Map
Nearby Homes