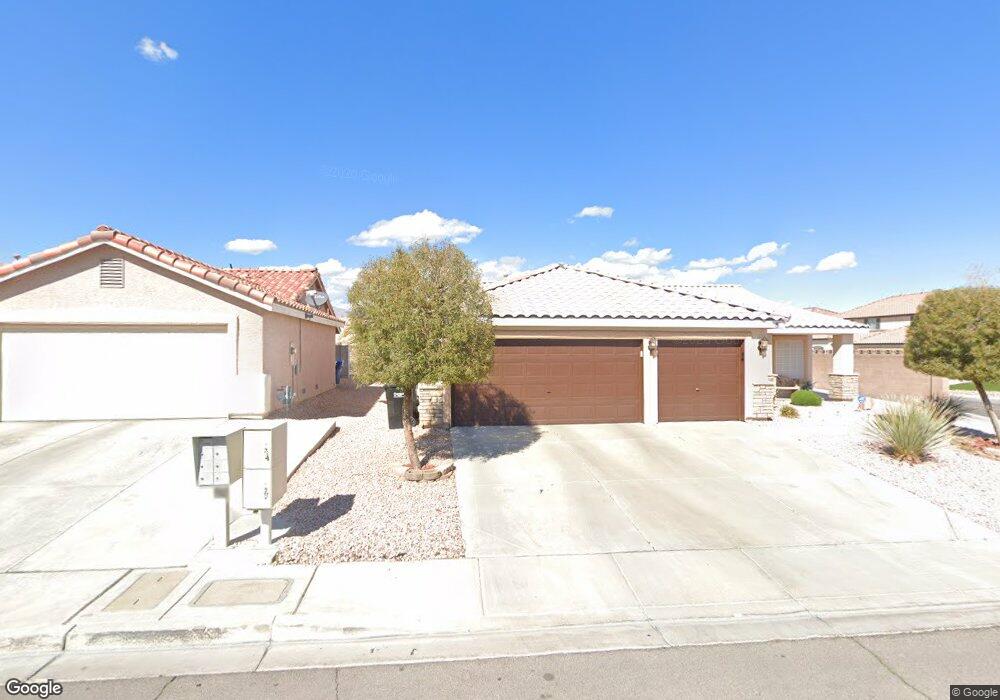
8 Calm Winds Ct North Las Vegas, NV 89031
Craig Ranch NeighborhoodEstimated Value: $386,000 - $421,000
4
Beds
2
Baths
1,595
Sq Ft
$252/Sq Ft
Est. Value
About This Home
This home is located at 8 Calm Winds Ct, North Las Vegas, NV 89031 and is currently estimated at $402,192, approximately $252 per square foot. 8 Calm Winds Ct is a home located in Clark County with nearby schools including Raul P. Elizondo Elementary School, Clifford O. Findlay Middle School, and Mojave High School.
Ownership History
Date
Name
Owned For
Owner Type
Purchase Details
Closed on
Jul 22, 2010
Sold by
Hsbc Bank Usa Na
Bought by
Corona Alfredo R
Current Estimated Value
Home Financials for this Owner
Home Financials are based on the most recent Mortgage that was taken out on this home.
Original Mortgage
$76,500
Outstanding Balance
$50,324
Interest Rate
4.52%
Mortgage Type
New Conventional
Estimated Equity
$351,868
Purchase Details
Closed on
May 5, 2010
Sold by
Gephart David and Gephart Denise
Bought by
Hsbc Bank Usa Na
Purchase Details
Closed on
Jul 26, 2001
Sold by
Steinhoff Steven M and Steinhoff Angela L
Bought by
Gephart David and Gephart Denise
Home Financials for this Owner
Home Financials are based on the most recent Mortgage that was taken out on this home.
Original Mortgage
$135,375
Interest Rate
7.15%
Mortgage Type
FHA
Purchase Details
Closed on
Jul 18, 1997
Sold by
Greystone Homes Inc
Bought by
Steinhoff Steven M and Steinhoff Angela L
Home Financials for this Owner
Home Financials are based on the most recent Mortgage that was taken out on this home.
Original Mortgage
$115,695
Interest Rate
7.83%
Mortgage Type
FHA
Create a Home Valuation Report for This Property
The Home Valuation Report is an in-depth analysis detailing your home's value as well as a comparison with similar homes in the area
Home Values in the Area
Average Home Value in this Area
Purchase History
| Date | Buyer | Sale Price | Title Company |
|---|---|---|---|
| Corona Alfredo R | $85,000 | Noble Title | |
| Hsbc Bank Usa Na | $110,000 | Accommodation | |
| Gephart David | $137,500 | Lawyers Title | |
| Steinhoff Steven M | $117,500 | Nevada Title Company |
Source: Public Records
Mortgage History
| Date | Status | Borrower | Loan Amount |
|---|---|---|---|
| Open | Corona Alfredo R | $76,500 | |
| Previous Owner | Gephart David | $135,375 | |
| Previous Owner | Steinhoff Steven M | $115,695 |
Source: Public Records
Tax History Compared to Growth
Tax History
| Year | Tax Paid | Tax Assessment Tax Assessment Total Assessment is a certain percentage of the fair market value that is determined by local assessors to be the total taxable value of land and additions on the property. | Land | Improvement |
|---|---|---|---|---|
| 2025 | $1,569 | $100,212 | $31,500 | $68,712 |
| 2024 | $1,524 | $100,212 | $31,500 | $68,712 |
| 2023 | $1,524 | $91,285 | $25,900 | $65,385 |
| 2022 | $1,551 | $83,086 | $23,100 | $59,986 |
| 2021 | $1,437 | $77,760 | $20,650 | $57,110 |
| 2020 | $1,331 | $76,533 | $19,950 | $56,583 |
| 2019 | $1,247 | $71,825 | $16,100 | $55,725 |
| 2018 | $1,190 | $66,663 | $12,600 | $54,063 |
| 2017 | $2,152 | $64,153 | $11,900 | $52,253 |
| 2016 | $1,115 | $54,548 | $8,400 | $46,148 |
| 2015 | $1,112 | $40,150 | $5,950 | $34,200 |
| 2014 | $1,077 | $32,042 | $4,900 | $27,142 |
Source: Public Records
Map
Nearby Homes
- 5509 Tea Leaf St
- 212 Stagecoach Flats Ave
- 138 Red Sandstone Ave
- 5512 Pride Mountain St
- 210 Red Sandstone Ave
- 138 Scarlett View Ave
- 129 Thorntree Ave
- 5703 Salt Rock St
- 5640 Vermillion Ridge St
- 5709 Jaysin Douglas St
- 415 Carsin Wayne Ave
- 5637 Vermillion Ridge St
- 5228 Daywood St
- 221 Mountain Cedar Ct
- 408 Colorful Rain Ave
- 210 Mountain Cedar Ct
- 5505 Moss Landing St
- 5521 Moss Landing St
- 104 Big Cliff Ave
- 5136 Stonecrop St
- 12 Calm Winds Ct Unit 2
- 7 Sunny Day Ave
- 11 Sunny Day Ave
- 16 Calm Winds Ct
- 5458 Goldfield St
- 7 Calm Winds Ct
- 5462 Goldfield St
- 5462 Goldfield St Unit n/a
- 15 Sunny Day Ave
- 11 Calm Winds Ct
- 5454 Goldfield St
- 5466 Goldfield St
- 15 Calm Winds Ct
- 5450 Goldfield St
- 19 Sunny Day Ave
- 19 Calm Winds Ct
- 19 Calm Winds Ct Unit n/a
- 24 Calm Winds Ct
- 8 Sunny Day Ave