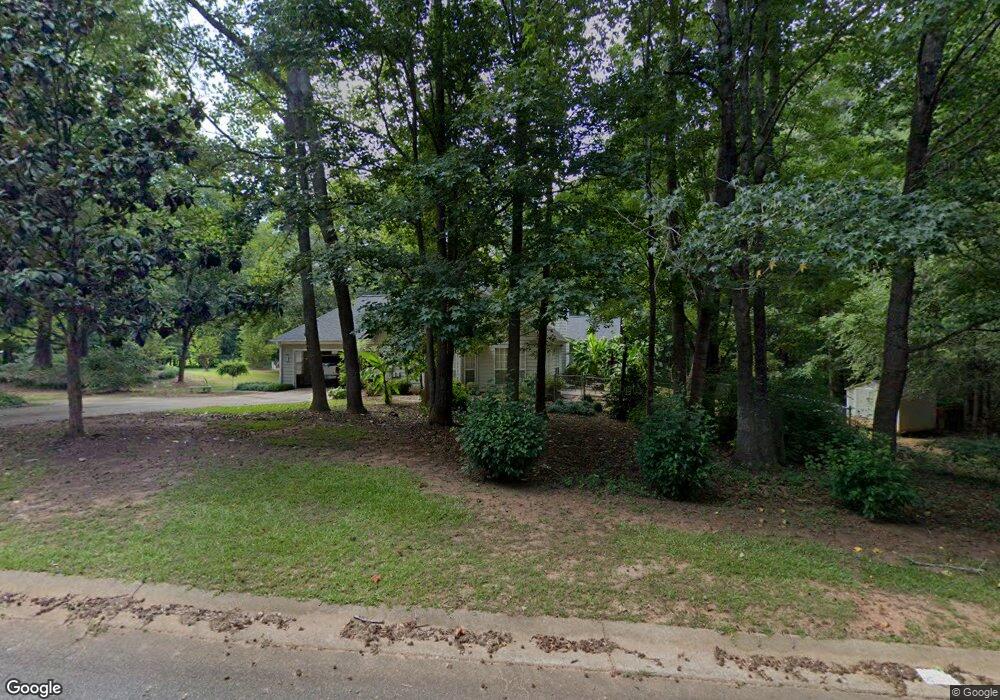
8 Camden Ln Sharpsburg, GA 30277
Estimated Value: $323,676 - $353,000
3
Beds
2
Baths
1,669
Sq Ft
$203/Sq Ft
Est. Value
About This Home
This home is located at 8 Camden Ln, Sharpsburg, GA 30277 and is currently estimated at $338,419, approximately $202 per square foot. 8 Camden Ln is a home located in Coweta County with nearby schools including Canongate Elementary School, Madras Middle School, and Northgate High School.
Ownership History
Date
Name
Owned For
Owner Type
Purchase Details
Closed on
Mar 28, 2002
Sold by
Rahaim Robert F
Bought by
Teal Gary L and Teal Lila B
Current Estimated Value
Home Financials for this Owner
Home Financials are based on the most recent Mortgage that was taken out on this home.
Original Mortgage
$105,000
Interest Rate
6.8%
Mortgage Type
New Conventional
Purchase Details
Closed on
May 12, 1995
Sold by
Greene Sharini S
Bought by
Rahaim Robert F
Purchase Details
Closed on
Feb 25, 1995
Bought by
Greene Sharmi S
Purchase Details
Closed on
Dec 31, 1993
Sold by
Preto Claire A
Bought by
Scruggs Brandon S and Scuggs Sharmi T
Home Financials for this Owner
Home Financials are based on the most recent Mortgage that was taken out on this home.
Original Mortgage
$93,472
Interest Rate
7.25%
Mortgage Type
FHA
Purchase Details
Closed on
Aug 11, 1993
Bought by
Preto Claire A Fba C
Purchase Details
Closed on
Apr 30, 1987
Bought by
Preto Claire A and Preto Bob
Create a Home Valuation Report for This Property
The Home Valuation Report is an in-depth analysis detailing your home's value as well as a comparison with similar homes in the area
Home Values in the Area
Average Home Value in this Area
Purchase History
| Date | Buyer | Sale Price | Title Company |
|---|---|---|---|
| Teal Gary L | $135,000 | -- | |
| Rahaim Robert F | $10,100 | -- | |
| Greene Sharmi S | -- | -- | |
| Scruggs Brandon S | $55,000 | -- | |
| Preto Claire A Fba C | $7,900 | -- | |
| Preto Claire A | -- | -- |
Source: Public Records
Mortgage History
| Date | Status | Borrower | Loan Amount |
|---|---|---|---|
| Closed | Teal Gary L | $105,000 | |
| Previous Owner | Scruggs Brandon S | $93,472 | |
| Closed | Rahaim Robert F | $0 |
Source: Public Records
Tax History Compared to Growth
Tax History
| Year | Tax Paid | Tax Assessment Tax Assessment Total Assessment is a certain percentage of the fair market value that is determined by local assessors to be the total taxable value of land and additions on the property. | Land | Improvement |
|---|---|---|---|---|
| 2025 | $2,763 | $114,898 | $26,000 | $88,898 |
| 2024 | $2,688 | $113,724 | $26,000 | $87,724 |
| 2023 | $2,688 | $101,895 | $22,000 | $79,895 |
| 2022 | $2,449 | $97,482 | $22,000 | $75,482 |
| 2021 | $1,988 | $73,687 | $18,000 | $55,687 |
| 2020 | $1,783 | $77,029 | $18,000 | $59,029 |
| 2019 | $1,956 | $65,193 | $14,000 | $51,193 |
| 2018 | $1,959 | $65,193 | $14,000 | $51,193 |
| 2017 | $1,834 | $60,927 | $14,000 | $46,927 |
| 2016 | $1,687 | $56,600 | $12,000 | $44,600 |
| 2015 | $1,659 | $56,600 | $12,000 | $44,600 |
| 2014 | $1,351 | $46,129 | $12,000 | $34,129 |
Source: Public Records
Map
Nearby Homes
- 28 Border Point
- 100 Ashland Trail
- 104 Ashland Trail
- 11 Line Creek Cir
- 110 Kylemore Pass
- 20 Skipton Ct
- 150 Kylemore Pass
- 121 Northwoods Rd
- 259 Strathmore Dr Unit 3
- 70 N Strathmore Dr
- 40 Wenham Ln
- 12 Race Point Way
- 95 Tyler Woods Dr
- 25 Sycamore Way
- 100 Clydesdale Ct
- 135 Crimson Ridge
- 9 Warrior Way
- 319 Beaconsfield Dr
- 200 Chaparral Trace
- 125 Cannongate Cir