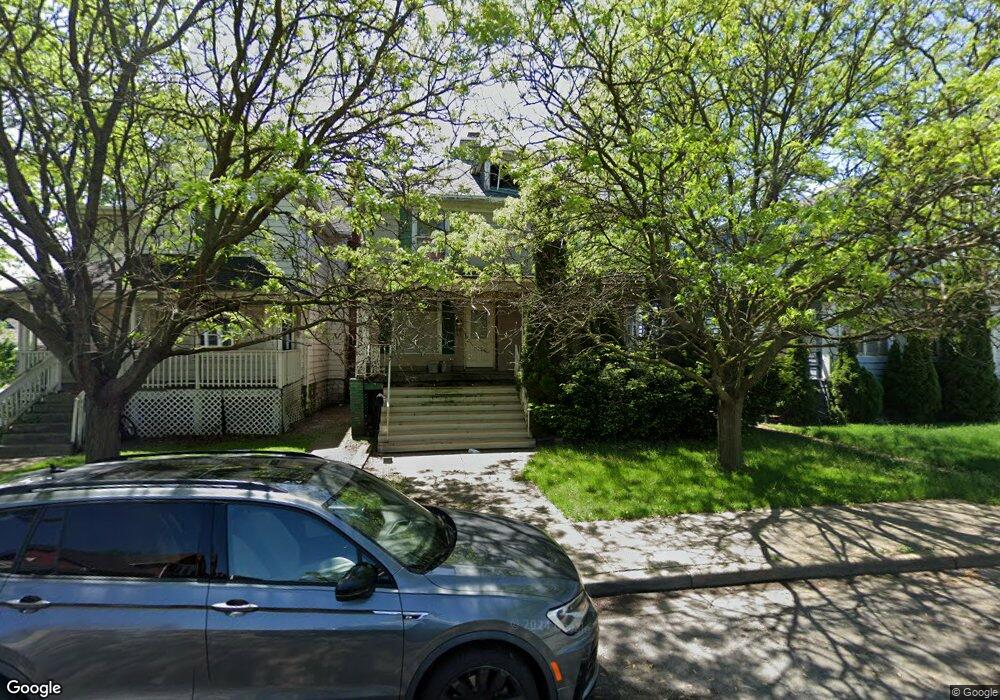
8 Carroll St Hammond, IN 46320
Estimated Value: $150,000 - $195,000
4
Beds
2
Baths
1,860
Sq Ft
$91/Sq Ft
Est. Value
About This Home
This home is located at 8 Carroll St, Hammond, IN 46320 and is currently estimated at $170,078, approximately $91 per square foot. 8 Carroll St is a home located in Lake County with nearby schools including Lew Wallace Elementary School, Eggers Middle School, and Hammond High School.
Ownership History
Date
Name
Owned For
Owner Type
Purchase Details
Closed on
Dec 16, 2009
Sold by
Fannie Mae
Bought by
Aguirre Fidel and Aguirre Angelica
Current Estimated Value
Purchase Details
Closed on
Oct 2, 2009
Sold by
Lampley Kenneth and Lampley Jannon
Bought by
Federal National Mortgage Association
Purchase Details
Closed on
Feb 12, 2008
Sold by
Lampley Kenneth and Lampley Jannon
Bought by
Lampley Kenneth and Lampley Jannon
Home Financials for this Owner
Home Financials are based on the most recent Mortgage that was taken out on this home.
Original Mortgage
$106,500
Interest Rate
5.9%
Mortgage Type
New Conventional
Purchase Details
Closed on
Jun 14, 2007
Sold by
Wells Fargo Bank Na
Bought by
Lampley Kenneth and Lampley Jannon
Home Financials for this Owner
Home Financials are based on the most recent Mortgage that was taken out on this home.
Original Mortgage
$103,200
Interest Rate
6.42%
Mortgage Type
Purchase Money Mortgage
Purchase Details
Closed on
Apr 7, 2006
Sold by
Signorelli Michael
Bought by
Wells Fargo Bank Na
Create a Home Valuation Report for This Property
The Home Valuation Report is an in-depth analysis detailing your home's value as well as a comparison with similar homes in the area
Home Values in the Area
Average Home Value in this Area
Purchase History
| Date | Buyer | Sale Price | Title Company |
|---|---|---|---|
| Aguirre Fidel | -- | Meridian Title Corp | |
| Federal National Mortgage Association | $130,857 | None Available | |
| Lampley Kenneth | -- | Chicago Title Insurance Co | |
| Lampley Kenneth | $79,900 | Multiple | |
| Wells Fargo Bank Na | $96,300 | None Available |
Source: Public Records
Mortgage History
| Date | Status | Borrower | Loan Amount |
|---|---|---|---|
| Previous Owner | Lampley Kenneth | $106,500 | |
| Previous Owner | Lampley Kenneth | $103,200 |
Source: Public Records
Tax History Compared to Growth
Tax History
| Year | Tax Paid | Tax Assessment Tax Assessment Total Assessment is a certain percentage of the fair market value that is determined by local assessors to be the total taxable value of land and additions on the property. | Land | Improvement |
|---|---|---|---|---|
| 2024 | $4,828 | $136,000 | $17,500 | $118,500 |
| 2023 | $1,228 | $101,000 | $16,700 | $84,300 |
| 2022 | $1,184 | $95,900 | $16,700 | $79,200 |
| 2021 | $954 | $79,500 | $8,400 | $71,100 |
| 2020 | $869 | $75,100 | $8,400 | $66,700 |
| 2019 | $940 | $70,600 | $9,800 | $60,800 |
| 2018 | $923 | $64,800 | $9,800 | $55,000 |
| 2017 | $880 | $62,000 | $9,800 | $52,200 |
| 2016 | $578 | $44,900 | $9,800 | $35,100 |
| 2014 | $508 | $45,100 | $9,800 | $35,300 |
| 2013 | $523 | $47,900 | $9,800 | $38,100 |
Source: Public Records
Map
Nearby Homes