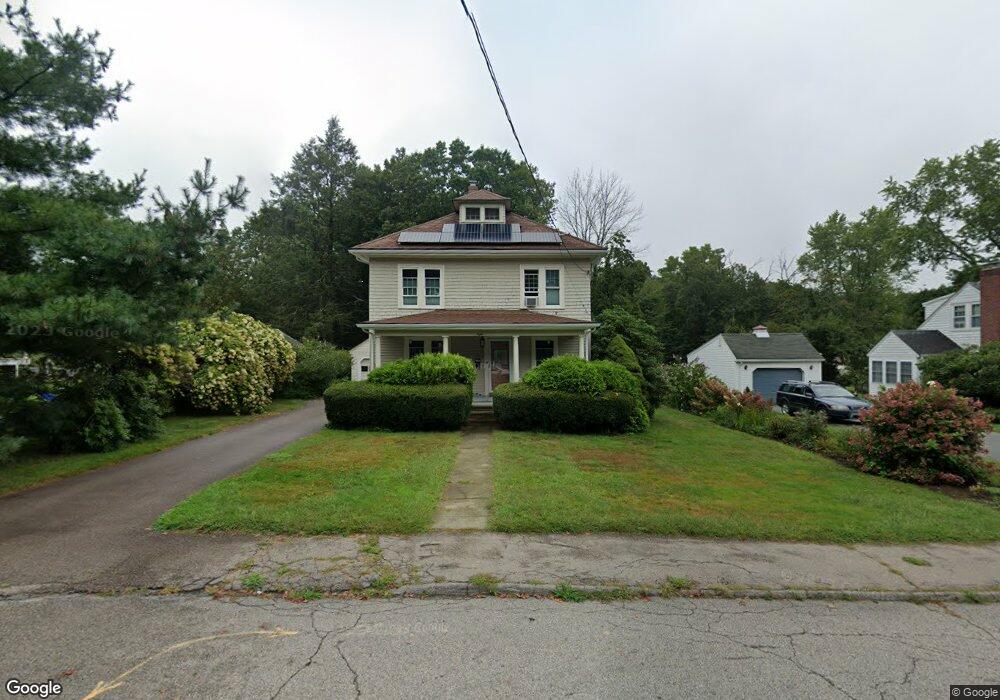
8 Cassidy Ln Medway, MA 02053
Estimated Value: $562,000 - $616,000
4
Beds
3
Baths
1,774
Sq Ft
$335/Sq Ft
Est. Value
About This Home
This home is located at 8 Cassidy Ln, Medway, MA 02053 and is currently estimated at $593,759, approximately $334 per square foot. 8 Cassidy Ln is a home located in Norfolk County with nearby schools including John D. McGovern Elementary School, Burke-Memorial Elementary, and Medway Middle School.
Ownership History
Date
Name
Owned For
Owner Type
Purchase Details
Closed on
Aug 16, 2011
Sold by
Est Evers Ellen and Evers John H
Bought by
Morse Jason D and Morse Ruth E
Current Estimated Value
Home Financials for this Owner
Home Financials are based on the most recent Mortgage that was taken out on this home.
Original Mortgage
$213,600
Outstanding Balance
$147,480
Interest Rate
4.51%
Mortgage Type
Purchase Money Mortgage
Estimated Equity
$446,279
Create a Home Valuation Report for This Property
The Home Valuation Report is an in-depth analysis detailing your home's value as well as a comparison with similar homes in the area
Home Values in the Area
Average Home Value in this Area
Purchase History
| Date | Buyer | Sale Price | Title Company |
|---|---|---|---|
| Morse Jason D | $267,000 | -- |
Source: Public Records
Mortgage History
| Date | Status | Borrower | Loan Amount |
|---|---|---|---|
| Open | Morse Jason D | $213,600 |
Source: Public Records
Tax History Compared to Growth
Tax History
| Year | Tax Paid | Tax Assessment Tax Assessment Total Assessment is a certain percentage of the fair market value that is determined by local assessors to be the total taxable value of land and additions on the property. | Land | Improvement |
|---|---|---|---|---|
| 2025 | $6,934 | $486,600 | $280,200 | $206,400 |
| 2024 | $7,007 | $486,600 | $280,200 | $206,400 |
| 2023 | $6,711 | $421,000 | $232,200 | $188,800 |
| 2022 | $6,477 | $382,600 | $206,200 | $176,400 |
| 2021 | $6,289 | $360,200 | $190,200 | $170,000 |
| 2020 | $6,036 | $344,900 | $176,100 | $168,800 |
| 2019 | $5,785 | $340,900 | $176,100 | $164,800 |
| 2018 | $5,692 | $322,300 | $152,100 | $170,200 |
| 2017 | $5,776 | $322,300 | $152,100 | $170,200 |
| 2016 | $5,469 | $302,000 | $134,500 | $167,500 |
| 2015 | $4,949 | $271,300 | $120,100 | $151,200 |
| 2014 | $5,011 | $266,000 | $128,100 | $137,900 |
Source: Public Records
Map
Nearby Homes
- 20 Broad St Unit 6
- 20 Broad St Unit A
- 20 Broad St Unit 4
- 14 Sanford St Unit 15
- 9 Sanford St
- 280 Village St Unit D2
- 841 Lincoln St
- 4 Shaw St
- 50 Main St
- 7 Gloucester Dr
- 22 Sunset Dr
- 0 Elm St
- 3 Meryl St
- 56 Fuller Place
- 106 Holliston St
- 2 Skyline Dr
- 12 Lovering St
- 14 Heritage Dr
- 28 Wellington St
- 36 Lovering St