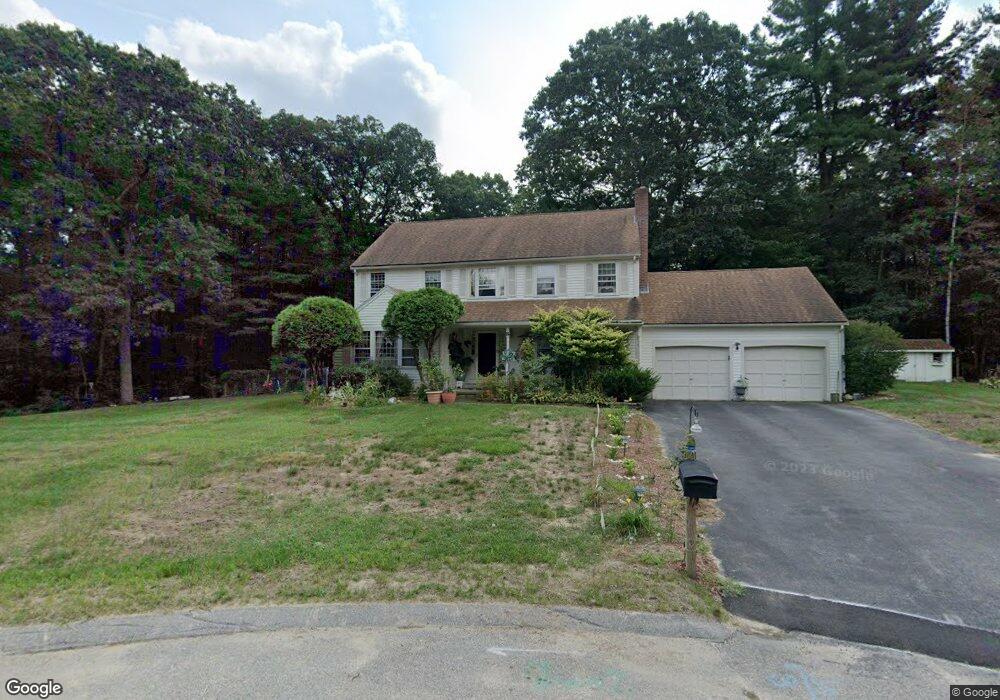
8 Castle Rd Medway, MA 02053
Estimated Value: $792,000 - $897,000
4
Beds
3
Baths
2,332
Sq Ft
$359/Sq Ft
Est. Value
About This Home
This home is located at 8 Castle Rd, Medway, MA 02053 and is currently estimated at $836,280, approximately $358 per square foot. 8 Castle Rd is a home located in Norfolk County with nearby schools including John D. McGovern Elementary School, Burke-Memorial Elementary, and Medway Middle School.
Ownership History
Date
Name
Owned For
Owner Type
Purchase Details
Closed on
Aug 31, 2000
Sold by
Coppola Anthony M and Coppola Cheryl L
Bought by
Saifullah Mohammed I and Saifullah Razia
Current Estimated Value
Home Financials for this Owner
Home Financials are based on the most recent Mortgage that was taken out on this home.
Original Mortgage
$252,000
Interest Rate
8.16%
Mortgage Type
Purchase Money Mortgage
Purchase Details
Closed on
Aug 13, 1992
Sold by
Weber Anne M
Bought by
Coppola Anthony M and Coppola Cheryl L
Create a Home Valuation Report for This Property
The Home Valuation Report is an in-depth analysis detailing your home's value as well as a comparison with similar homes in the area
Home Values in the Area
Average Home Value in this Area
Purchase History
| Date | Buyer | Sale Price | Title Company |
|---|---|---|---|
| Saifullah Mohammed I | $315,000 | -- | |
| Coppola Anthony M | $191,000 | -- |
Source: Public Records
Mortgage History
| Date | Status | Borrower | Loan Amount |
|---|---|---|---|
| Open | Coppola Anthony M | $220,000 | |
| Closed | Coppola Anthony M | $252,000 |
Source: Public Records
Tax History
| Year | Tax Paid | Tax Assessment Tax Assessment Total Assessment is a certain percentage of the fair market value that is determined by local assessors to be the total taxable value of land and additions on the property. | Land | Improvement |
|---|---|---|---|---|
| 2025 | $9,986 | $700,800 | $343,500 | $357,300 |
| 2024 | $10,092 | $700,800 | $343,500 | $357,300 |
| 2023 | $9,999 | $627,300 | $313,000 | $314,300 |
| 2022 | $9,146 | $540,200 | $232,400 | $307,800 |
| 2021 | $9,133 | $523,100 | $217,100 | $306,000 |
| 2020 | $9,107 | $520,400 | $217,100 | $303,300 |
| 2019 | $8,493 | $500,500 | $208,400 | $292,100 |
| 2018 | $8,560 | $484,700 | $199,700 | $285,000 |
| 2017 | $8,537 | $476,400 | $195,400 | $281,000 |
| 2016 | $8,173 | $451,300 | $180,100 | $271,200 |
| 2015 | $8,108 | $444,500 | $177,900 | $266,600 |
| 2014 | $7,730 | $410,300 | $181,700 | $228,600 |
Source: Public Records
Map
Nearby Homes
- 22 Granite St
- 15 Fox Run Rd
- 42 Fisher St
- 462 Hartford Ave
- 56 Fisher St
- 28 Fisher St
- 2 Kingson Ln Unit 2
- 394 Village St
- 8 Liberty Rd
- 6 Freedom Trail
- 8 Apache Rd
- 56 Puddingstone Ln
- 23 Cedar Farms Rd
- 22 Milford St
- 4 Linda Ln
- 21 Maple St
- 20 Hawthorne Village Unit A
- 19 Sahlin Cir
- 21 Carp Rd
- 18 Mary Anne Dr
Your Personal Tour Guide
Ask me questions while you tour the home.