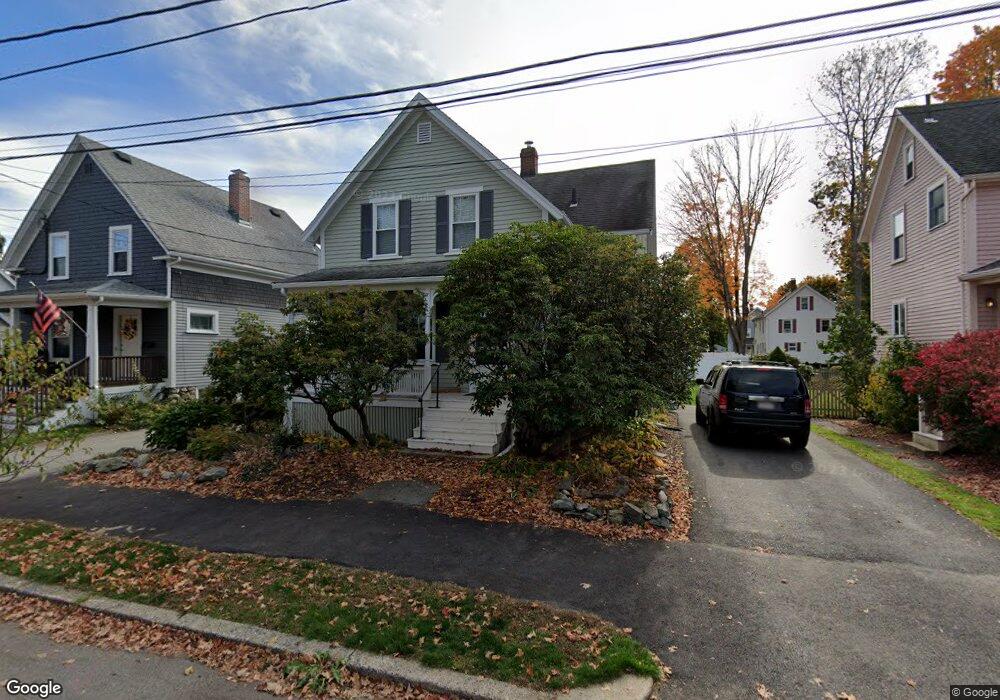
8 Cedar Ct Wakefield, MA 01880
West Side NeighborhoodEstimated Value: $673,092 - $689,000
3
Beds
2
Baths
1,234
Sq Ft
$550/Sq Ft
Est. Value
About This Home
This home is located at 8 Cedar Ct, Wakefield, MA 01880 and is currently estimated at $678,773, approximately $550 per square foot. 8 Cedar Ct is a home located in Middlesex County with nearby schools including Wakefield Memorial High School, St Joseph School, and St. Patrick Elementary School.
Ownership History
Date
Name
Owned For
Owner Type
Purchase Details
Closed on
Jul 13, 2010
Sold by
Roberts David F and Roberts Denise D
Bought by
Wagner Bradley P and Wagner Julie M
Current Estimated Value
Home Financials for this Owner
Home Financials are based on the most recent Mortgage that was taken out on this home.
Original Mortgage
$256,000
Outstanding Balance
$170,625
Interest Rate
4.78%
Mortgage Type
Purchase Money Mortgage
Estimated Equity
$508,148
Purchase Details
Closed on
Jun 21, 1991
Sold by
Roberts Cecil M and Roberts Helenm
Bought by
Roberts David F and Roberts Denise D
Home Financials for this Owner
Home Financials are based on the most recent Mortgage that was taken out on this home.
Original Mortgage
$103,000
Interest Rate
9.37%
Mortgage Type
Purchase Money Mortgage
Create a Home Valuation Report for This Property
The Home Valuation Report is an in-depth analysis detailing your home's value as well as a comparison with similar homes in the area
Home Values in the Area
Average Home Value in this Area
Purchase History
| Date | Buyer | Sale Price | Title Company |
|---|---|---|---|
| Wagner Bradley P | $320,000 | -- | |
| Roberts David F | $140,000 | -- |
Source: Public Records
Mortgage History
| Date | Status | Borrower | Loan Amount |
|---|---|---|---|
| Open | Wagner Bradley P | $256,000 | |
| Previous Owner | Roberts David F | $105,300 | |
| Previous Owner | Roberts David F | $103,000 |
Source: Public Records
Tax History
| Year | Tax Paid | Tax Assessment Tax Assessment Total Assessment is a certain percentage of the fair market value that is determined by local assessors to be the total taxable value of land and additions on the property. | Land | Improvement |
|---|---|---|---|---|
| 2025 | $6,410 | $564,800 | $342,500 | $222,300 |
| 2024 | $6,317 | $561,500 | $340,500 | $221,000 |
| 2023 | $6,007 | $512,100 | $310,500 | $201,600 |
| 2022 | $5,749 | $466,600 | $282,800 | $183,800 |
| 2021 | $5,686 | $446,700 | $263,600 | $183,100 |
| 2020 | $5,333 | $417,600 | $246,400 | $171,200 |
| 2019 | $5,095 | $397,100 | $234,300 | $162,800 |
| 2018 | $4,746 | $366,500 | $216,100 | $150,400 |
| 2017 | $4,463 | $342,500 | $202,000 | $140,500 |
| 2016 | $4,460 | $330,600 | $191,100 | $139,500 |
| 2015 | $4,165 | $309,000 | $178,600 | $130,400 |
| 2014 | $3,797 | $297,100 | $171,700 | $125,400 |
Source: Public Records
Map
Nearby Homes
- 248 Albion St Unit 231
- 248 Albion St Unit 321
- 62 Foundry St Unit 310
- 62 Foundry St Unit 312
- 62 Foundry St Unit 204
- 62 Foundry St Unit 202
- 62 Foundry St Unit 208
- 62 Foundry St Unit 414
- 252 Albion St Unit 3
- 69 Foundry St Unit 310
- 69 Foundry St Unit 416
- 95 Prospect St
- 4 Adams St
- 55 Bartley St
- 43-45 Crescent St
- 16 Pleasant St
- 21 Herbert St Unit A
- 29 Cordis St
- 1 Summit Dr Unit 57
- 68 Preston St Unit 6D
Your Personal Tour Guide
Ask me questions while you tour the home.