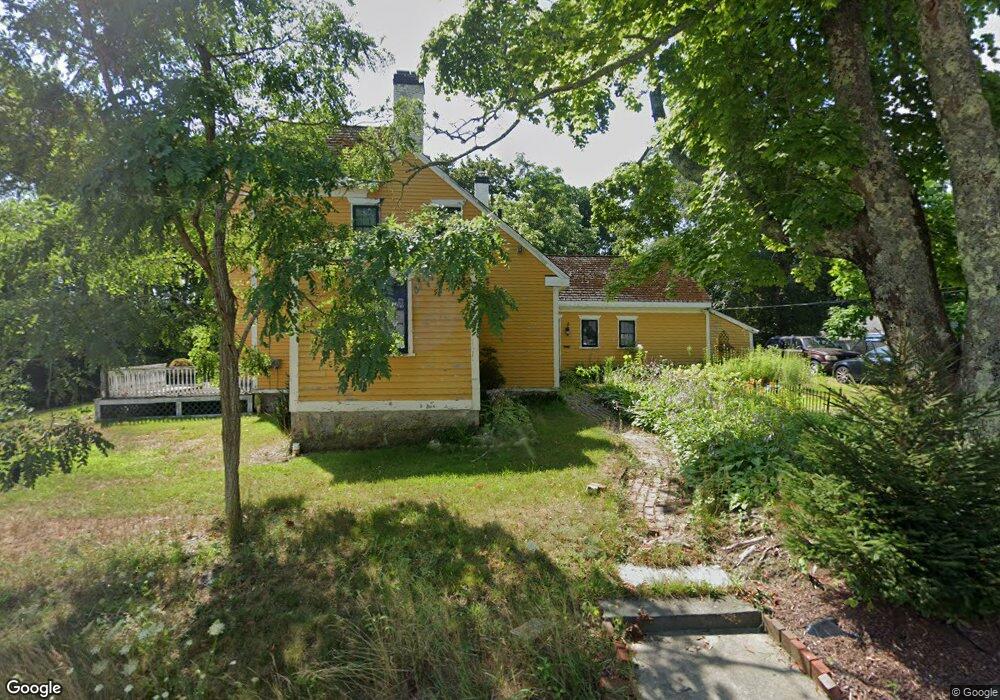
8 Cedar St Wareham, MA 02571
Wareham Center NeighborhoodEstimated Value: $725,476 - $1,011,000
4
Beds
3
Baths
1,801
Sq Ft
$466/Sq Ft
Est. Value
About This Home
This home is located at 8 Cedar St, Wareham, MA 02571 and is currently estimated at $839,119, approximately $465 per square foot. 8 Cedar St is a home located in Plymouth County.
Ownership History
Date
Name
Owned For
Owner Type
Purchase Details
Closed on
May 28, 1999
Sold by
Mcmorrow David E and Mcmorrow Carolyn
Bought by
Santilli David B and Hastreiter Kristine L
Current Estimated Value
Home Financials for this Owner
Home Financials are based on the most recent Mortgage that was taken out on this home.
Original Mortgage
$251,500
Interest Rate
6.82%
Mortgage Type
Purchase Money Mortgage
Purchase Details
Closed on
Nov 13, 1989
Sold by
Harding William E
Bought by
Mcmorrow David E
Create a Home Valuation Report for This Property
The Home Valuation Report is an in-depth analysis detailing your home's value as well as a comparison with similar homes in the area
Home Values in the Area
Average Home Value in this Area
Purchase History
| Date | Buyer | Sale Price | Title Company |
|---|---|---|---|
| Santilli David B | $280,000 | -- | |
| Santilli David B | $280,000 | -- | |
| Mcmorrow David E | $310,000 | -- | |
| Mcmorrow David E | $310,000 | -- |
Source: Public Records
Mortgage History
| Date | Status | Borrower | Loan Amount |
|---|---|---|---|
| Open | Mcmorrow David E | $280,000 | |
| Closed | Mcmorrow David E | $251,500 |
Source: Public Records
Tax History
| Year | Tax Paid | Tax Assessment Tax Assessment Total Assessment is a certain percentage of the fair market value that is determined by local assessors to be the total taxable value of land and additions on the property. | Land | Improvement |
|---|---|---|---|---|
| 2025 | $6,029 | $578,600 | $119,200 | $459,400 |
| 2024 | $6,338 | $564,400 | $95,400 | $469,000 |
| 2023 | $5,565 | $514,600 | $87,000 | $427,600 |
| 2022 | $5,565 | $422,200 | $87,000 | $335,200 |
| 2021 | $5,057 | $376,000 | $87,000 | $289,000 |
| 2020 | $4,824 | $363,800 | $87,000 | $276,800 |
| 2019 | $4,790 | $360,400 | $89,700 | $270,700 |
| 2018 | $4,377 | $321,100 | $89,700 | $231,400 |
| 2017 | $4,496 | $334,300 | $89,700 | $244,600 |
| 2016 | $4,173 | $308,400 | $89,800 | $218,600 |
| 2015 | $3,963 | $303,200 | $89,800 | $213,400 |
| 2014 | $3,728 | $290,100 | $85,300 | $204,800 |
Source: Public Records
Map
Nearby Homes
- 106 Circuit Ave
- 4 Ross Ave
- 10 Oak St
- 15 Broadmarsh Ave
- 110 Mayflower Ridge Dr
- 4 Mather Dr
- 6 Allen Ave
- 3 Lynne Rd
- 437 Main St
- 3 Cranberry Grove Way Unit C
- 20 Grant St
- 55 Minot Ave Unit 55
- 43 Shore Ave
- 6 Bourne Terrace
- 17 Lynne Rd
- 6 Pine St
- 6 Wildwood Ave
- 3 Hazel St
- 2645 Cranberry Hwy Unit A
- 21 Bayview St
Your Personal Tour Guide
Ask me questions while you tour the home.