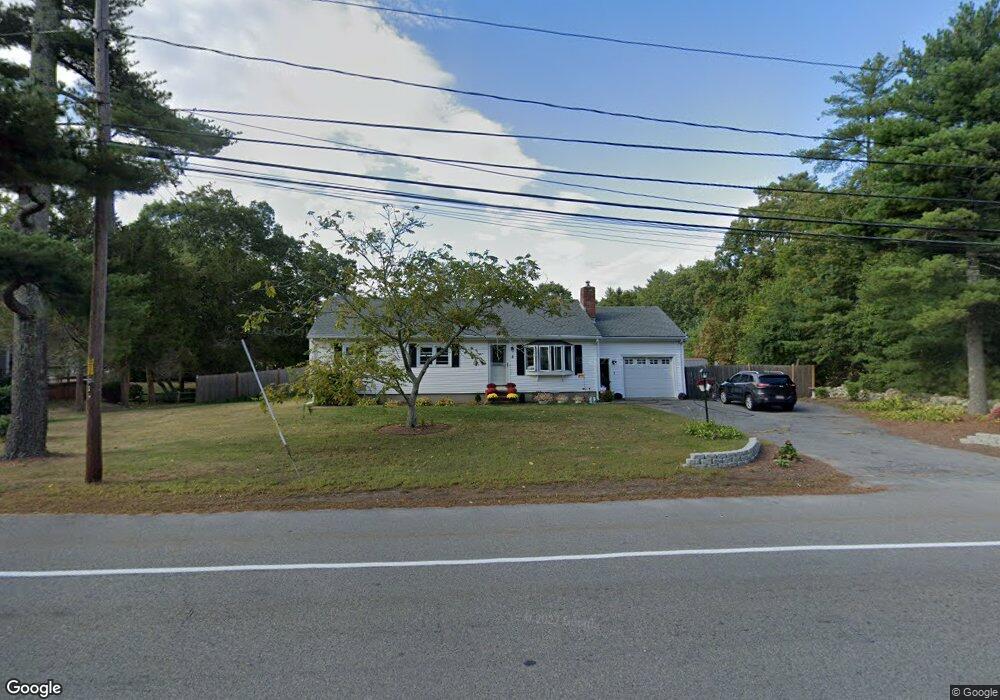
8 Chace Rd East Freetown, MA 02717
Estimated Value: $528,000 - $545,000
3
Beds
2
Baths
1,423
Sq Ft
$375/Sq Ft
Est. Value
About This Home
This home is located at 8 Chace Rd, East Freetown, MA 02717 and is currently estimated at $533,359, approximately $374 per square foot. 8 Chace Rd is a home located in Bristol County with nearby schools including Freetown Elementary School, George R Austin Intermediate School, and Freetown-Lakeville Middle School.
Ownership History
Date
Name
Owned For
Owner Type
Purchase Details
Closed on
Sep 26, 2022
Sold by
Lapre Tiffani
Bought by
Lapre Tiffani and Lapre Ryan
Current Estimated Value
Home Financials for this Owner
Home Financials are based on the most recent Mortgage that was taken out on this home.
Original Mortgage
$250,000
Outstanding Balance
$235,445
Interest Rate
5.55%
Mortgage Type
Credit Line Revolving
Estimated Equity
$297,914
Purchase Details
Closed on
Oct 14, 2015
Sold by
Dearden Louise A
Bought by
Crook Tiffani
Home Financials for this Owner
Home Financials are based on the most recent Mortgage that was taken out on this home.
Original Mortgage
$100,000
Interest Rate
3.88%
Mortgage Type
New Conventional
Purchase Details
Closed on
Sep 16, 2008
Sold by
Dearden-Jarabek Bonnie J and Dearden Laurie A
Bought by
Dearden Clarence R and Dearden Louise A
Create a Home Valuation Report for This Property
The Home Valuation Report is an in-depth analysis detailing your home's value as well as a comparison with similar homes in the area
Home Values in the Area
Average Home Value in this Area
Purchase History
| Date | Buyer | Sale Price | Title Company |
|---|---|---|---|
| Lapre Tiffani | -- | None Available | |
| Lapre Tiffani | -- | None Available | |
| Crook Tiffani | $250,000 | -- | |
| Dearden Clarence R | -- | -- | |
| Dearden Clarence R | -- | -- |
Source: Public Records
Mortgage History
| Date | Status | Borrower | Loan Amount |
|---|---|---|---|
| Open | Lapre Tiffani | $250,000 | |
| Previous Owner | Crook Tiffani | $100,000 | |
| Previous Owner | Dearden Clarence R | $25,000 |
Source: Public Records
Tax History Compared to Growth
Tax History
| Year | Tax Paid | Tax Assessment Tax Assessment Total Assessment is a certain percentage of the fair market value that is determined by local assessors to be the total taxable value of land and additions on the property. | Land | Improvement |
|---|---|---|---|---|
| 2025 | $4,043 | $408,000 | $156,200 | $251,800 |
| 2024 | $4,018 | $385,200 | $147,400 | $237,800 |
| 2023 | $3,819 | $356,600 | $132,700 | $223,900 |
| 2022 | $3,639 | $301,700 | $112,400 | $189,300 |
| 2021 | $3,490 | $274,800 | $102,300 | $172,500 |
| 2020 | $3,431 | $263,500 | $98,400 | $165,100 |
| 2019 | $3,273 | $248,900 | $93,700 | $155,200 |
| 2018 | $3,096 | $232,600 | $93,700 | $138,900 |
| 2017 | $3,040 | $228,200 | $93,700 | $134,500 |
| 2016 | $2,902 | $221,700 | $91,000 | $130,700 |
| 2015 | $2,576 | $199,700 | $91,000 | $108,700 |
| 2014 | $2,468 | $195,700 | $89,100 | $106,600 |
Source: Public Records
Map
Nearby Homes
- 11 Gurney Rd
- 23 Parker Dr
- 0 Costa Dr
- 8 Denise Ave
- 144 Chace Rd
- 4597 Acushnet Ave
- 24 Bells Brook Rd
- 19 Hilltop Acres Dr
- 3 Elaine Ave
- 1599 Braley Rd Unit 68
- 36 Winfield St
- 1573 Braley Rd Unit 39
- 2 Hayes St
- 120 Hackett Ave
- Lot 2 Sherwood Ln
- Lot 1 Sherwood Ln
- 595 Quanapoag Rd
- 16 Swallow St
- 13 Luscomb Ln
- 15 Morrison Way