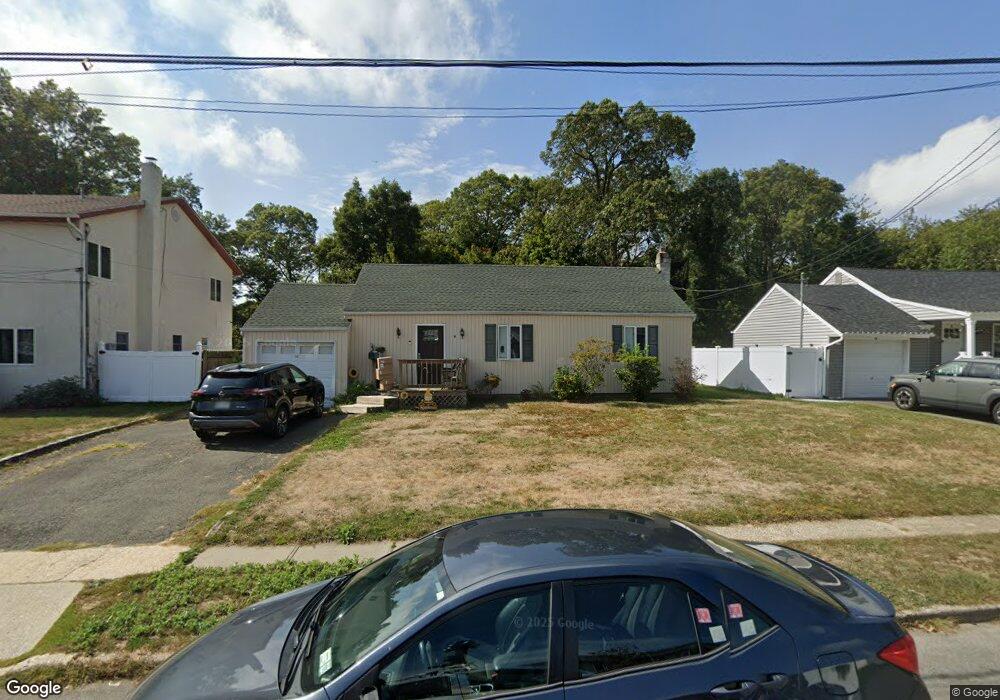
8 Chapel Place North Babylon, NY 11703
Estimated Value: $569,915 - $662,000
--
Bed
--
Bath
1,146
Sq Ft
$536/Sq Ft
Est. Value
About This Home
This home is located at 8 Chapel Place, North Babylon, NY 11703 and is currently estimated at $614,229, approximately $535 per square foot. 8 Chapel Place is a home located in Suffolk County with nearby schools including Robert Moses Middle School and North Babylon High School.
Ownership History
Date
Name
Owned For
Owner Type
Purchase Details
Closed on
Apr 19, 2010
Sold by
Gutmann Craig and Gutmann Eudora
Bought by
Gutmann Craig
Current Estimated Value
Home Financials for this Owner
Home Financials are based on the most recent Mortgage that was taken out on this home.
Original Mortgage
$208,587
Interest Rate
5.25%
Mortgage Type
FHA
Purchase Details
Closed on
Feb 9, 2004
Sold by
Gutmann Arline and Gutmann Craig
Bought by
Gutmann Craig and Gutmann Eudora
Home Financials for this Owner
Home Financials are based on the most recent Mortgage that was taken out on this home.
Original Mortgage
$178,000
Interest Rate
5.62%
Mortgage Type
New Conventional
Purchase Details
Closed on
Oct 6, 1999
Sold by
Gutmann Arline
Bought by
Gutmann Arline and Gutmann Craig
Home Financials for this Owner
Home Financials are based on the most recent Mortgage that was taken out on this home.
Original Mortgage
$110,000
Interest Rate
7.83%
Create a Home Valuation Report for This Property
The Home Valuation Report is an in-depth analysis detailing your home's value as well as a comparison with similar homes in the area
Home Values in the Area
Average Home Value in this Area
Purchase History
| Date | Buyer | Sale Price | Title Company |
|---|---|---|---|
| Gutmann Craig | -- | -- | |
| Gutmann Craig | -- | -- | |
| Gutmann Arline | -- | -- |
Source: Public Records
Mortgage History
| Date | Status | Borrower | Loan Amount |
|---|---|---|---|
| Previous Owner | Gutmann Craig | $208,587 | |
| Previous Owner | Gutmann Craig | $178,000 | |
| Previous Owner | Gutmann Arline | $110,000 |
Source: Public Records
Tax History Compared to Growth
Tax History
| Year | Tax Paid | Tax Assessment Tax Assessment Total Assessment is a certain percentage of the fair market value that is determined by local assessors to be the total taxable value of land and additions on the property. | Land | Improvement |
|---|---|---|---|---|
| 2024 | $9,101 | $2,975 | $365 | $2,610 |
| 2023 | $9,101 | $2,975 | $365 | $2,610 |
| 2022 | $7,490 | $2,975 | $365 | $2,610 |
| 2021 | $7,490 | $2,975 | $365 | $2,610 |
| 2020 | $7,994 | $2,975 | $365 | $2,610 |
| 2019 | $7,994 | $0 | $0 | $0 |
| 2018 | $7,633 | $2,975 | $365 | $2,610 |
| 2017 | $7,633 | $2,975 | $365 | $2,610 |
| 2016 | $7,530 | $2,975 | $365 | $2,610 |
| 2015 | -- | $2,975 | $365 | $2,610 |
| 2014 | -- | $2,975 | $365 | $2,610 |
Source: Public Records
Map
Nearby Homes
- 1233 August Rd
- 4 Terry Ct
- 56 Magro Dr
- 20 Pell Ave
- 14 Eastwood Dr
- 662 Interlaken Ln
- 128 Kime Ave
- 11 Southwood Ln
- 27 Primrose Ln
- 120 Glen Rd
- 1 Primrose Ln Unit 1
- 5 Primrose Ln
- 11 Primrose Ln Unit 11
- 32 Phelps Ln
- 104 Woods Rd
- 22 Herman Ave
- 78 Phelps Ln
- 42 Primrose Ln Unit 42
- 61 Primrose Ln Unit 61
- 24 Dulittle St
- 4 Chapel Place
- 12 Chapel Place
- 4 Chapel Place
- 16 Chapel Place
- 7 Chapel Place
- 11 Chapel Place
- 1224 August Rd
- 20 Chapel Place
- 1240 August Rd
- 1239 August Rd
- 1243 August Rd
- 4 Parkside Ln
- 11 Parkside Ln
- 24 Chapel Place
- 1220 August Rd
- 8 Terry Ct
- 23 Chapel Place
- 15 Parkside Ln
- 28 Chapel Place
- 1229 August Rd