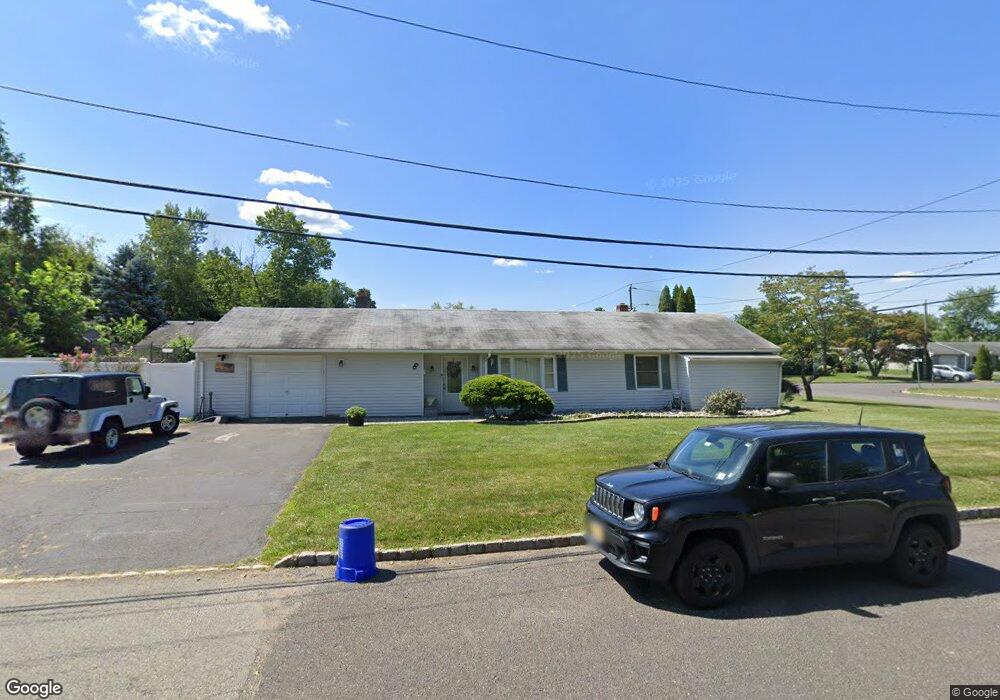
8 Charles St Bridgewater, NJ 08807
Estimated Value: $468,000 - $535,000
3
Beds
2
Baths
1,524
Sq Ft
$336/Sq Ft
Est. Value
About This Home
This home is located at 8 Charles St, Bridgewater, NJ 08807 and is currently estimated at $511,643, approximately $335 per square foot. 8 Charles St is a home located in Somerset County with nearby schools including Adamsville Primary School, Bridgewater-Raritan Middle School, and Hillside Intermediate School.
Ownership History
Date
Name
Owned For
Owner Type
Purchase Details
Closed on
Aug 29, 2016
Sold by
Willimgton Savings Fund Society
Bought by
Vaguerio John and Barbosa Nancy
Current Estimated Value
Home Financials for this Owner
Home Financials are based on the most recent Mortgage that was taken out on this home.
Original Mortgage
$215,000
Outstanding Balance
$171,734
Interest Rate
3.43%
Mortgage Type
New Conventional
Estimated Equity
$339,909
Purchase Details
Closed on
Apr 21, 2015
Sold by
Costa Joao A and Costa Aldegundes A
Bought by
Trusts Christian
Create a Home Valuation Report for This Property
The Home Valuation Report is an in-depth analysis detailing your home's value as well as a comparison with similar homes in the area
Home Values in the Area
Average Home Value in this Area
Purchase History
| Date | Buyer | Sale Price | Title Company |
|---|---|---|---|
| Vaguerio John | $275,000 | Multiple | |
| Trusts Christian | $1,000 | None Available |
Source: Public Records
Mortgage History
| Date | Status | Borrower | Loan Amount |
|---|---|---|---|
| Open | Vaguerio John | $215,000 |
Source: Public Records
Tax History Compared to Growth
Tax History
| Year | Tax Paid | Tax Assessment Tax Assessment Total Assessment is a certain percentage of the fair market value that is determined by local assessors to be the total taxable value of land and additions on the property. | Land | Improvement |
|---|---|---|---|---|
| 2025 | $7,622 | $391,000 | $206,500 | $184,500 |
| 2024 | $7,622 | $386,700 | $206,500 | $180,200 |
| 2023 | $7,035 | $350,500 | $206,500 | $144,000 |
| 2022 | $6,406 | $307,100 | $201,500 | $105,600 |
| 2021 | $6,395 | $301,000 | $201,500 | $99,500 |
| 2020 | $6,378 | $299,700 | $201,500 | $98,200 |
| 2019 | $6,395 | $297,600 | $201,500 | $96,100 |
| 2018 | $6,338 | $295,600 | $201,500 | $94,100 |
| 2017 | $6,198 | $288,800 | $201,500 | $87,300 |
| 2016 | $5,988 | $283,100 | $201,500 | $81,600 |
| 2015 | $5,950 | $281,600 | $201,500 | $80,100 |
| 2014 | $5,849 | $272,700 | $201,500 | $71,200 |
Source: Public Records
Map
Nearby Homes