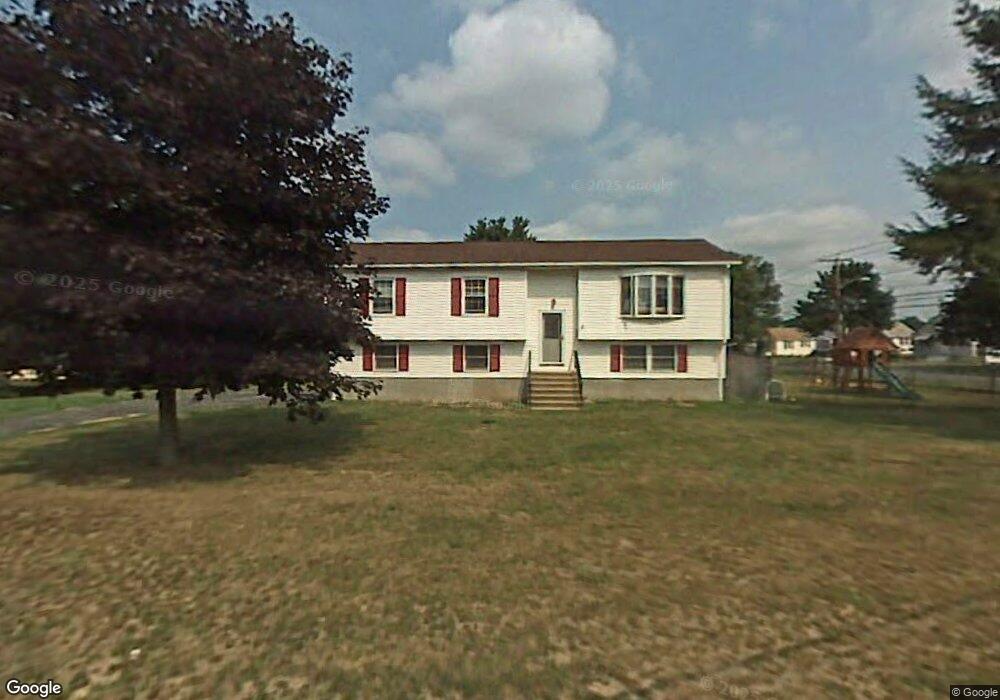
8 Charles St Ludlow, MA 01056
Estimated Value: $339,740 - $374,000
2
Beds
2
Baths
1,698
Sq Ft
$209/Sq Ft
Est. Value
About This Home
This home is located at 8 Charles St, Ludlow, MA 01056 and is currently estimated at $355,435, approximately $209 per square foot. 8 Charles St is a home located in Hampden County with nearby schools including East Street Elementary School, Chapin Street Elementary School, and Paul R. Baird Middle School.
Ownership History
Date
Name
Owned For
Owner Type
Purchase Details
Closed on
Mar 23, 2011
Sold by
Volker Richard E
Bought by
Volker Jennifer L
Current Estimated Value
Purchase Details
Closed on
Mar 29, 2004
Sold by
Volker Jennifer L
Bought by
Volker Jennifer L and Volker Richard E
Purchase Details
Closed on
Jul 8, 1992
Sold by
Fletcher John E
Bought by
Hohol Michael E and Hohol Jennifer L
Create a Home Valuation Report for This Property
The Home Valuation Report is an in-depth analysis detailing your home's value as well as a comparison with similar homes in the area
Home Values in the Area
Average Home Value in this Area
Purchase History
| Date | Buyer | Sale Price | Title Company |
|---|---|---|---|
| Volker Jennifer L | -- | -- | |
| Volker Jennifer L | -- | -- | |
| Volker Jennifer L | -- | -- | |
| Volker Jennifer L | -- | -- | |
| Hohol Michael E | $125,000 | -- | |
| Hohol Michael E | $125,000 | -- |
Source: Public Records
Mortgage History
| Date | Status | Borrower | Loan Amount |
|---|---|---|---|
| Previous Owner | Hohol Michael E | $64,000 | |
| Previous Owner | Hohol Michael E | $50,000 |
Source: Public Records
Tax History Compared to Growth
Tax History
| Year | Tax Paid | Tax Assessment Tax Assessment Total Assessment is a certain percentage of the fair market value that is determined by local assessors to be the total taxable value of land and additions on the property. | Land | Improvement |
|---|---|---|---|---|
| 2025 | $4,454 | $256,700 | $74,300 | $182,400 |
| 2024 | $4,389 | $242,600 | $74,200 | $168,400 |
| 2023 | $4,156 | $213,000 | $61,700 | $151,300 |
| 2022 | $3,940 | $197,100 | $61,700 | $135,400 |
| 2021 | $3,980 | $188,800 | $61,700 | $127,100 |
| 2020 | $3,813 | $184,900 | $60,700 | $124,200 |
| 2019 | $3,750 | $189,200 | $60,100 | $129,100 |
| 2018 | $3,507 | $184,500 | $60,100 | $124,400 |
| 2017 | $3,654 | $197,200 | $61,200 | $136,000 |
| 2016 | $3,559 | $196,300 | $60,000 | $136,300 |
| 2015 | $3,522 | $203,700 | $59,400 | $144,300 |
Source: Public Records
Map
Nearby Homes
- 350 West St Unit 19
- 482 Holyoke St
- 319 West St
- 251 West St
- 1307 Burnett Rd
- 41 Deroche Cir
- 3 Fontaine St
- 61 Massachusetts Ave
- 1133 Burnett Rd
- 1130 Burnett Rd
- 166 Kendall St
- 42 Roy St
- 33 Grimard St
- 58 Mariana Ln
- 26 Lark Dr
- 32 Mockingbird Dr
- 98 Fuller St Unit 32
- 0 Nash Hill Rd
- 84 Fuller St Unit 1
- 7 Finch Dr