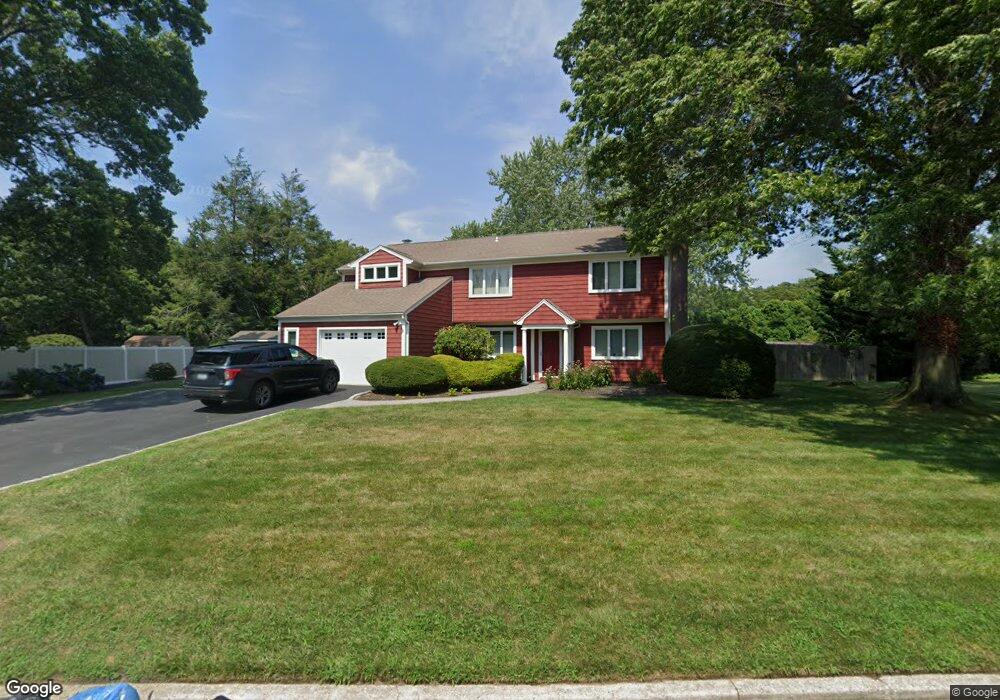
8 Chelsea Dr Mount Sinai, NY 11766
Estimated Value: $658,000 - $705,642
4
Beds
2
Baths
1,852
Sq Ft
$371/Sq Ft
Est. Value
About This Home
This home is located at 8 Chelsea Dr, Mount Sinai, NY 11766 and is currently estimated at $687,411, approximately $371 per square foot. 8 Chelsea Dr is a home located in Suffolk County with nearby schools including Mount Sinai Middle School, Mount Sinai Elementary School, and Mount Sinai High School.
Ownership History
Date
Name
Owned For
Owner Type
Purchase Details
Closed on
May 29, 2010
Sold by
Pope Lynn
Bought by
Pope Lynn and Pope Allison L
Current Estimated Value
Purchase Details
Closed on
Aug 28, 1999
Sold by
Pope Brian and Pope Lynn
Bought by
Pope Lynn
Create a Home Valuation Report for This Property
The Home Valuation Report is an in-depth analysis detailing your home's value as well as a comparison with similar homes in the area
Home Values in the Area
Average Home Value in this Area
Purchase History
| Date | Buyer | Sale Price | Title Company |
|---|---|---|---|
| Pope Lynn | -- | -- | |
| Pope Lynn | -- | Chicago Title Insurance Co |
Source: Public Records
Tax History Compared to Growth
Tax History
| Year | Tax Paid | Tax Assessment Tax Assessment Total Assessment is a certain percentage of the fair market value that is determined by local assessors to be the total taxable value of land and additions on the property. | Land | Improvement |
|---|---|---|---|---|
| 2024 | $16,209 | $4,025 | $450 | $3,575 |
| 2023 | $16,209 | $4,025 | $450 | $3,575 |
| 2022 | $14,411 | $4,025 | $450 | $3,575 |
| 2021 | $14,411 | $4,025 | $450 | $3,575 |
| 2020 | $14,777 | $4,025 | $450 | $3,575 |
| 2019 | $14,777 | $0 | $0 | $0 |
| 2018 | $14,093 | $4,025 | $450 | $3,575 |
| 2017 | $14,093 | $4,025 | $450 | $3,575 |
| 2016 | $13,281 | $3,825 | $450 | $3,375 |
| 2015 | -- | $3,825 | $450 | $3,375 |
| 2014 | -- | $3,825 | $450 | $3,375 |
Source: Public Records
Map
Nearby Homes