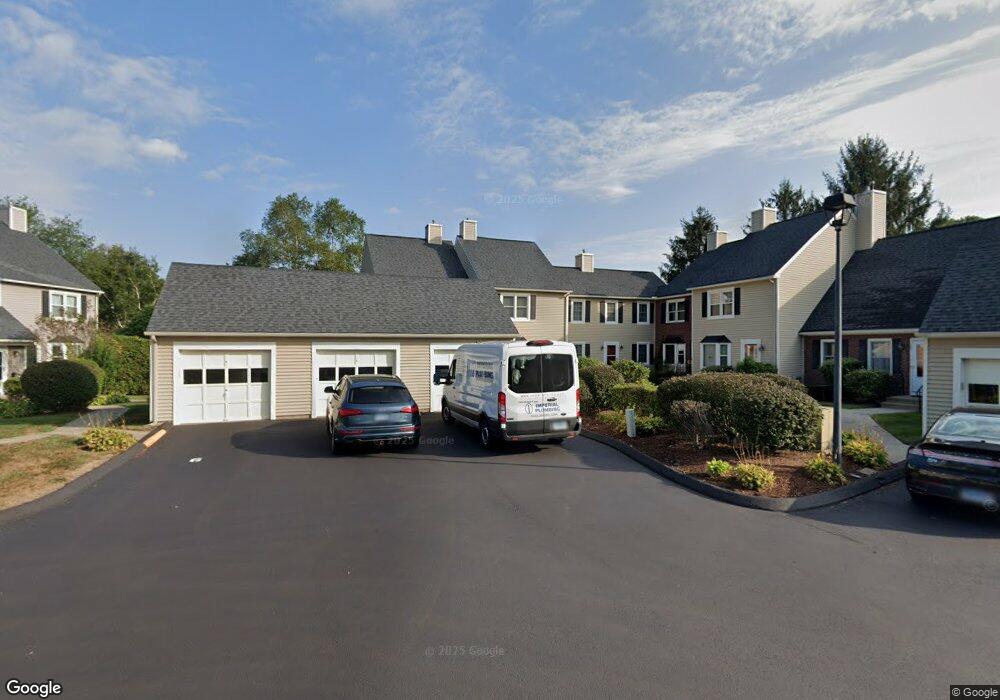
8 Cheltenham Ct Suffield, CT 06078
Estimated Value: $292,306 - $313,000
2
Beds
2
Baths
1,234
Sq Ft
$248/Sq Ft
Est. Value
About This Home
This home is located at 8 Cheltenham Ct, Suffield, CT 06078 and is currently estimated at $306,327, approximately $248 per square foot. 8 Cheltenham Ct is a home located in Hartford County with nearby schools including A. Ward Spaulding School, Mcalister Intermediate School, and Suffield Middle School.
Ownership History
Date
Name
Owned For
Owner Type
Purchase Details
Closed on
Mar 29, 2018
Sold by
Morgan Clinton
Bought by
Lebel Tara A
Current Estimated Value
Home Financials for this Owner
Home Financials are based on the most recent Mortgage that was taken out on this home.
Original Mortgage
$95,000
Outstanding Balance
$81,584
Interest Rate
4.38%
Mortgage Type
Purchase Money Mortgage
Estimated Equity
$224,743
Purchase Details
Closed on
Jul 19, 2011
Sold by
Yagodzinski Jennifer C
Bought by
Morgan Clinton
Home Financials for this Owner
Home Financials are based on the most recent Mortgage that was taken out on this home.
Original Mortgage
$185,940
Interest Rate
4.58%
Purchase Details
Closed on
Aug 31, 2006
Sold by
Squires Lisa
Bought by
Yagodzinski Jennifer
Purchase Details
Closed on
Aug 1, 1997
Sold by
Forbes Edna
Bought by
Squires Lisa
Home Financials for this Owner
Home Financials are based on the most recent Mortgage that was taken out on this home.
Original Mortgage
$76,950
Interest Rate
7.55%
Mortgage Type
Unknown
Create a Home Valuation Report for This Property
The Home Valuation Report is an in-depth analysis detailing your home's value as well as a comparison with similar homes in the area
Home Values in the Area
Average Home Value in this Area
Purchase History
| Date | Buyer | Sale Price | Title Company |
|---|---|---|---|
| Lebel Tara A | $160,000 | -- | |
| Morgan Clinton | $181,000 | -- | |
| Yagodzinski Jennifer | $175,000 | -- | |
| Squires Lisa | $81,000 | -- |
Source: Public Records
Mortgage History
| Date | Status | Borrower | Loan Amount |
|---|---|---|---|
| Open | Lebel Tara A | $95,000 | |
| Previous Owner | Squires Lisa | $185,940 | |
| Previous Owner | Squires Lisa | $76,950 |
Source: Public Records
Tax History
| Year | Tax Paid | Tax Assessment Tax Assessment Total Assessment is a certain percentage of the fair market value that is determined by local assessors to be the total taxable value of land and additions on the property. | Land | Improvement |
|---|---|---|---|---|
| 2025 | $3,651 | $155,960 | $0 | $155,960 |
| 2024 | $3,529 | $155,960 | $0 | $155,960 |
| 2023 | $3,038 | $106,190 | $0 | $106,190 |
| 2022 | $3,038 | $106,190 | $0 | $106,190 |
| 2021 | $3,041 | $106,190 | $0 | $106,190 |
| 2020 | $3,041 | $106,190 | $0 | $106,190 |
| 2019 | $3,050 | $106,190 | $0 | $106,190 |
| 2018 | $3,220 | $109,830 | $0 | $109,830 |
| 2017 | $3,173 | $109,830 | $0 | $109,830 |
| 2016 | $3,097 | $109,830 | $0 | $109,830 |
| 2015 | $3,051 | $109,830 | $0 | $109,830 |
| 2014 | $2,979 | $109,830 | $0 | $109,830 |
Source: Public Records
Map
Nearby Homes
- 24 Pebblestone Cir Unit 24
- 147 W Grayling Ln
- 3 Pebblestone Cir Unit 3
- 4 Pebblestone Cir
- 80 S River St
- 69 Prospect St
- 47 Maple Ave
- 242 Pearl St
- 45 Douglas St
- 57 Asnuntuck St
- 98 1st St
- 41 Walnut St
- 270 Pearl St
- 11 Orchard Hill Dr
- 5 Claremont Ave
- 40 Church St
- 30-32 Church St
- 26-28 Church St
- 97 Pleasant St
- 148 Pleasant St
- 18 Cheltenham Ct
- 16 Cheltenham Ct
- 14 Cheltenham Ct
- 12 Cheltenham Ct
- 10 Cheltenham Ct
- 6 Cheltenham Ct
- 5 Cheltenham Ct
- 4 Cheltenham Ct
- 2 Cheltenham Ct
- 1 Cheltenham Ct
- 5 Cheltenham Ct Unit 5
- 8 Cheltenham Ct Unit 8
- 6 Cheltenham Ct Unit 6
- 1 Cheltenham Ct Unit 1
- 10 Cheltenham Ct Unit 10
- 17 Cheltenham Ct
- 15 Cheltenham Ct
- 13 Cheltenham Ct
- 11 Cheltenham Ct
- 9 Cheltenham Ct
Your Personal Tour Guide
Ask me questions while you tour the home.