Estimated Value: $257,000 - $505,665
5
Beds
3
Baths
3,160
Sq Ft
$104/Sq Ft
Est. Value
About This Home
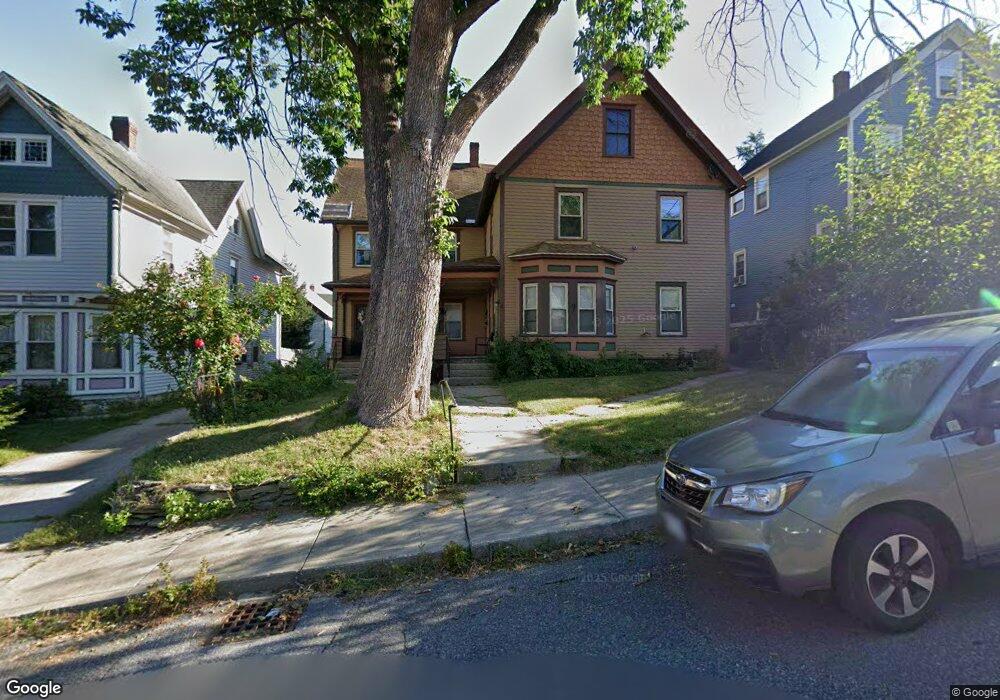
This home is located at 8 Cherry St, Adams, MA 01220 and is currently estimated at $328,916, approximately $104 per square foot. 8 Cherry St is a home located in Berkshire County with nearby schools including Hoosac Valley Middle & High School, Berkshire Arts & Technology Charter Public School, and St. Stanislaus Kostka School.
Ownership History
Date
Name
Owned For
Owner Type
Purchase Details
Closed on
Oct 21, 2013
Sold by
Kopala Stanley J
Bought by
Clermont Nancy A
Current Estimated Value
Purchase Details
Closed on
Jun 6, 2006
Sold by
Kopala Stanley J and Kopala Sylvia L
Bought by
Kopala Stanley J
Purchase Details
Closed on
Oct 21, 1988
Sold by
Hunter Joan F
Bought by
Moriarty Michael K
Home Financials for this Owner
Home Financials are based on the most recent Mortgage that was taken out on this home.
Original Mortgage
$91,200
Interest Rate
10.48%
Mortgage Type
Purchase Money Mortgage
Create a Home Valuation Report for This Property
The Home Valuation Report is an in-depth analysis detailing your home's value as well as a comparison with similar homes in the area
Home Values in the Area
Average Home Value in this Area
Purchase History
| Date | Buyer | Sale Price | Title Company |
|---|---|---|---|
| Clermont Nancy A | -- | -- | |
| Kopala Stanley J | -- | -- | |
| Moriarty Michael K | $114,000 | -- |
Source: Public Records
Mortgage History
| Date | Status | Borrower | Loan Amount |
|---|---|---|---|
| Previous Owner | Moriarty Michael K | $91,200 |
Source: Public Records
Tax History
| Year | Tax Paid | Tax Assessment Tax Assessment Total Assessment is a certain percentage of the fair market value that is determined by local assessors to be the total taxable value of land and additions on the property. | Land | Improvement |
|---|---|---|---|---|
| 2025 | $3,489 | $205,100 | $43,100 | $162,000 |
| 2024 | $3,291 | $187,600 | $40,400 | $147,200 |
| 2023 | $3,089 | $166,500 | $37,200 | $129,300 |
| 2022 | $3,029 | $145,000 | $32,300 | $112,700 |
| 2021 | $3,171 | $140,200 | $32,300 | $107,900 |
| 2020 | $3,096 | $141,500 | $32,400 | $109,100 |
| 2019 | $3,027 | $141,500 | $32,400 | $109,100 |
| 2018 | $3,098 | $139,500 | $32,400 | $107,100 |
| 2017 | $2,981 | $139,500 | $32,400 | $107,100 |
| 2016 | $2,845 | $133,000 | $32,400 | $100,600 |
| 2015 | $2,774 | $129,800 | $34,100 | $95,700 |
| 2014 | $2,590 | $129,800 | $34,100 | $95,700 |
Source: Public Records
Map
Nearby Homes
Your Personal Tour Guide
Ask me questions while you tour the home.