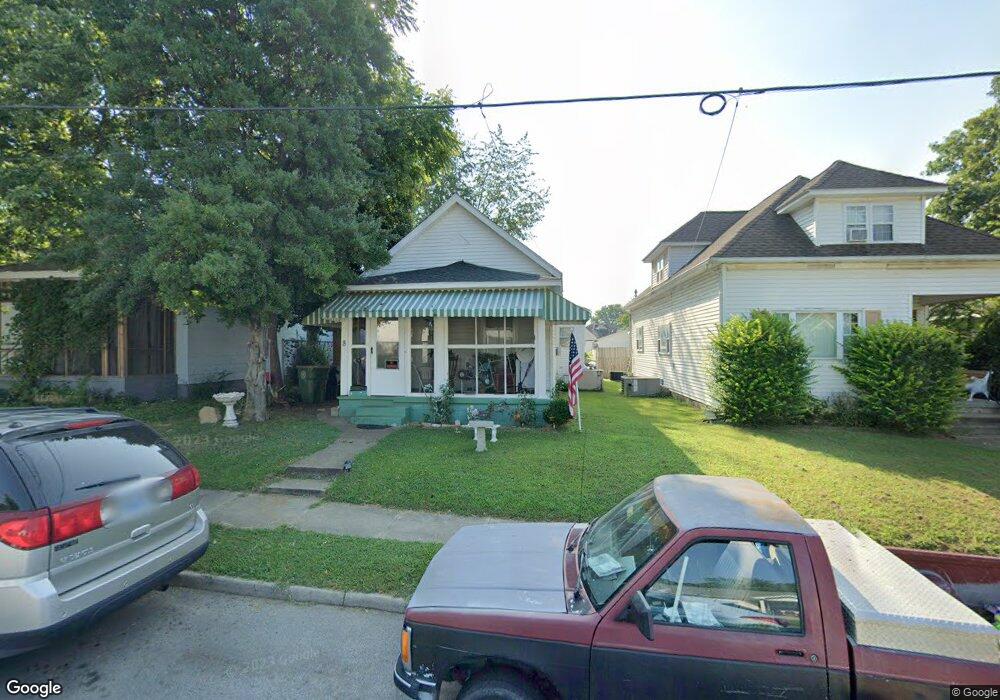
8 Clark St Henderson, KY 42420
Henderson East End NeighborhoodEstimated Value: $75,000 - $167,000
2
Beds
1
Bath
2,082
Sq Ft
$51/Sq Ft
Est. Value
About This Home
This home is located at 8 Clark St, Henderson, KY 42420 and is currently estimated at $106,073, approximately $50 per square foot. 8 Clark St is a home located in Henderson County with nearby schools including East Heights Elementary School, Henderson County North Middle School, and Henderson County High School.
Ownership History
Date
Name
Owned For
Owner Type
Purchase Details
Closed on
Dec 11, 2020
Sold by
Coomes Martin E and Coomes Donna M
Bought by
Barron Deborah
Current Estimated Value
Home Financials for this Owner
Home Financials are based on the most recent Mortgage that was taken out on this home.
Original Mortgage
$50,000
Outstanding Balance
$36,371
Interest Rate
2.8%
Mortgage Type
New Conventional
Estimated Equity
$69,702
Purchase Details
Closed on
Jul 25, 2011
Sold by
Sugg David Joel and Sugg Christopher E
Bought by
Coomes Martin E and Coomes Donna M
Create a Home Valuation Report for This Property
The Home Valuation Report is an in-depth analysis detailing your home's value as well as a comparison with similar homes in the area
Home Values in the Area
Average Home Value in this Area
Purchase History
| Date | Buyer | Sale Price | Title Company |
|---|---|---|---|
| Barron Deborah | $50,000 | None Available | |
| Coomes Martin E | $8,500 | None Available |
Source: Public Records
Mortgage History
| Date | Status | Borrower | Loan Amount |
|---|---|---|---|
| Open | Barron Deborah | $50,000 |
Source: Public Records
Tax History Compared to Growth
Tax History
| Year | Tax Paid | Tax Assessment Tax Assessment Total Assessment is a certain percentage of the fair market value that is determined by local assessors to be the total taxable value of land and additions on the property. | Land | Improvement |
|---|---|---|---|---|
| 2024 | $40 | $50,000 | $0 | $0 |
| 2023 | $41 | $50,000 | $0 | $0 |
| 2022 | $105 | $50,000 | $0 | $0 |
| 2021 | $555 | $50,000 | $0 | $0 |
| 2020 | $363 | $33,500 | $0 | $0 |
| 2019 | $356 | $33,500 | $0 | $0 |
| 2018 | $357 | $33,500 | $0 | $0 |
| 2017 | $349 | $33,500 | $0 | $0 |
| 2016 | $331 | $33,500 | $0 | $0 |
| 2014 | $304 | $33,500 | $7,500 | $26,000 |
Source: Public Records
Map
Nearby Homes