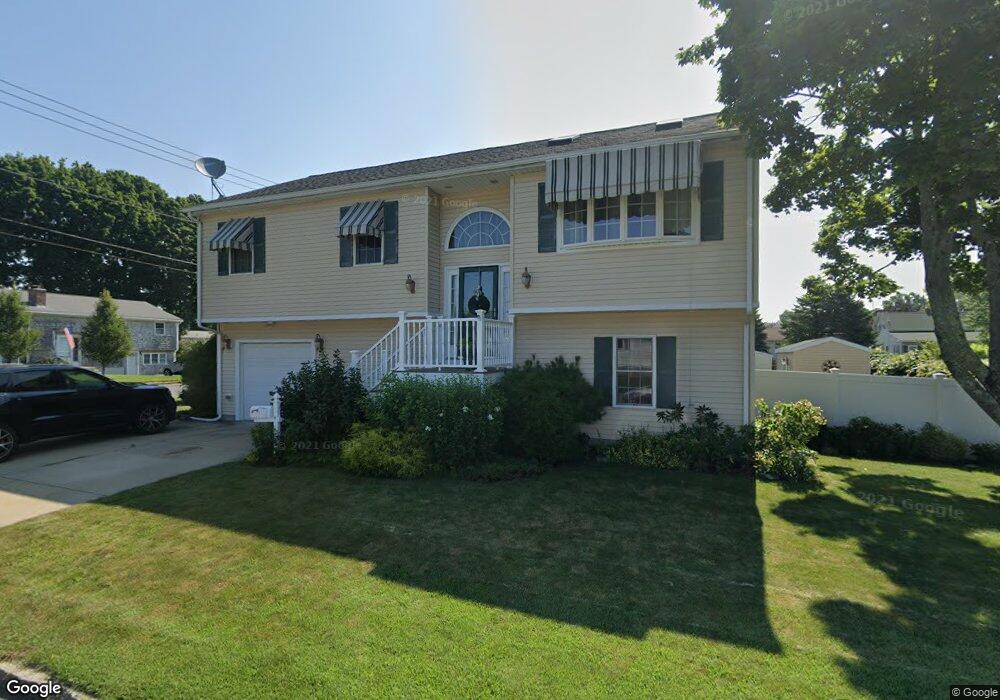
8 Clay St Fall River, MA 02724
Maplewood NeighborhoodEstimated Value: $383,000 - $438,000
3
Beds
1
Bath
1,000
Sq Ft
$417/Sq Ft
Est. Value
About This Home
This home is located at 8 Clay St, Fall River, MA 02724 and is currently estimated at $416,790, approximately $416 per square foot. 8 Clay St is a home located in Bristol County with nearby schools including Letourneau Elementary School, Matthew J. Kuss Middle School, and B M C Durfee High School.
Ownership History
Date
Name
Owned For
Owner Type
Purchase Details
Closed on
May 14, 2015
Sold by
Faria Teresa A and Camara Diane M
Bought by
Faria Teresa and Faria Alfredo J
Current Estimated Value
Purchase Details
Closed on
Dec 21, 2012
Sold by
Faria Teresa A
Bought by
Camara Diane M and Faria Alfredo J
Purchase Details
Closed on
Aug 12, 2008
Sold by
Sullivan Kyle M
Bought by
Faria Teresa A
Home Financials for this Owner
Home Financials are based on the most recent Mortgage that was taken out on this home.
Original Mortgage
$150,000
Interest Rate
6.49%
Mortgage Type
Purchase Money Mortgage
Purchase Details
Closed on
May 27, 2008
Sold by
Sullivan Kenneth J
Bought by
Sullivan Kyle M
Create a Home Valuation Report for This Property
The Home Valuation Report is an in-depth analysis detailing your home's value as well as a comparison with similar homes in the area
Home Values in the Area
Average Home Value in this Area
Purchase History
| Date | Buyer | Sale Price | Title Company |
|---|---|---|---|
| Faria Teresa | -- | -- | |
| Camara Diane M | -- | -- | |
| Faria Teresa A | $249,900 | -- | |
| Sullivan Kyle M | -- | -- |
Source: Public Records
Mortgage History
| Date | Status | Borrower | Loan Amount |
|---|---|---|---|
| Previous Owner | Faria Teresa A | $150,000 |
Source: Public Records
Tax History
| Year | Tax Paid | Tax Assessment Tax Assessment Total Assessment is a certain percentage of the fair market value that is determined by local assessors to be the total taxable value of land and additions on the property. | Land | Improvement |
|---|---|---|---|---|
| 2025 | $4,433 | $387,200 | $116,700 | $270,500 |
| 2024 | $3,978 | $346,200 | $114,400 | $231,800 |
| 2023 | $3,993 | $325,400 | $103,100 | $222,300 |
| 2022 | $3,515 | $278,500 | $97,200 | $181,300 |
| 2021 | $3,459 | $250,100 | $92,900 | $157,200 |
| 2020 | $3,368 | $233,100 | $88,600 | $144,500 |
| 2019 | $3,451 | $236,700 | $92,600 | $144,100 |
| 2018 | $3,332 | $227,900 | $93,300 | $134,600 |
| 2017 | $3,174 | $226,700 | $93,300 | $133,400 |
| 2016 | $3,044 | $223,300 | $96,200 | $127,100 |
| 2015 | $2,783 | $212,800 | $96,200 | $116,600 |
| 2014 | -- | $212,800 | $96,200 | $116,600 |
Source: Public Records
Map
Nearby Homes
Your Personal Tour Guide
Ask me questions while you tour the home.