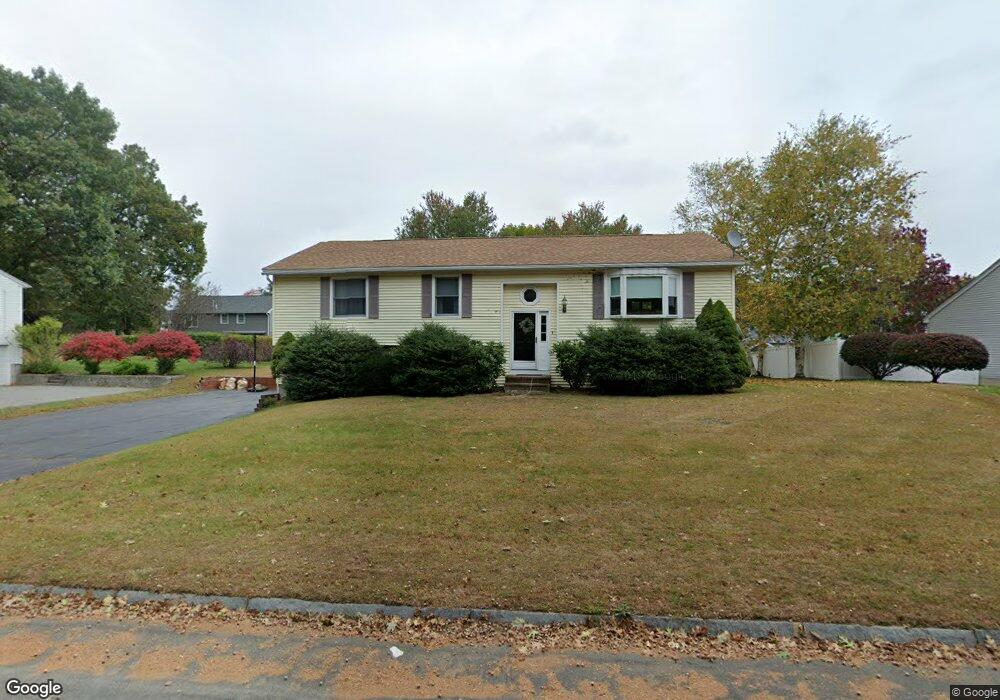
8 Clementi Ln Methuen, MA 01844
The East End NeighborhoodEstimated Value: $589,863 - $707,000
3
Beds
2
Baths
2,239
Sq Ft
$282/Sq Ft
Est. Value
About This Home
This home is located at 8 Clementi Ln, Methuen, MA 01844 and is currently estimated at $631,716, approximately $282 per square foot. 8 Clementi Ln is a home located in Essex County with nearby schools including Methuen High School, Community Day Charter Public School - Gateway, and Esperanza Academy School of Hope.
Ownership History
Date
Name
Owned For
Owner Type
Purchase Details
Closed on
Sep 1, 2023
Sold by
Campbell Robert P
Bought by
Campbell Robert P and Campbell Linda
Current Estimated Value
Purchase Details
Closed on
Jun 30, 2021
Sold by
Patel Manish and Patel Komal
Bought by
Campbell Robert P
Home Financials for this Owner
Home Financials are based on the most recent Mortgage that was taken out on this home.
Original Mortgage
$427,121
Interest Rate
2.9%
Mortgage Type
FHA
Purchase Details
Closed on
Jan 15, 2002
Sold by
Carrick Ronald A and Demarco Elizabeth A
Bought by
Patel Manish and Patel Komal
Create a Home Valuation Report for This Property
The Home Valuation Report is an in-depth analysis detailing your home's value as well as a comparison with similar homes in the area
Home Values in the Area
Average Home Value in this Area
Purchase History
| Date | Buyer | Sale Price | Title Company |
|---|---|---|---|
| Campbell Robert P | -- | None Available | |
| Campbell Robert P | -- | None Available | |
| Campbell Robert P | -- | None Available | |
| Campbell Robert P | $435,000 | None Available | |
| Patel Manish | $281,500 | -- | |
| Patel Manish | $281,500 | -- |
Source: Public Records
Mortgage History
| Date | Status | Borrower | Loan Amount |
|---|---|---|---|
| Previous Owner | Campbell Robert P | $427,121 | |
| Previous Owner | Patel Manish | $172,000 |
Source: Public Records
Tax History
| Year | Tax Paid | Tax Assessment Tax Assessment Total Assessment is a certain percentage of the fair market value that is determined by local assessors to be the total taxable value of land and additions on the property. | Land | Improvement |
|---|---|---|---|---|
| 2025 | $5,803 | $548,500 | $207,200 | $341,300 |
| 2024 | $5,807 | $534,700 | $182,000 | $352,700 |
| 2023 | $5,446 | $465,500 | $161,000 | $304,500 |
| 2022 | $5,315 | $407,300 | $140,000 | $267,300 |
| 2021 | $5,033 | $381,600 | $133,000 | $248,600 |
| 2020 | $4,978 | $370,400 | $133,000 | $237,400 |
| 2019 | $4,867 | $343,000 | $126,000 | $217,000 |
| 2018 | $4,576 | $320,700 | $119,000 | $201,700 |
| 2017 | $4,360 | $297,600 | $119,000 | $178,600 |
| 2016 | $4,295 | $290,000 | $119,000 | $171,000 |
| 2015 | $4,075 | $279,100 | $112,000 | $167,100 |
Source: Public Records
Map
Nearby Homes
- 16 Christopher Dr Unit 38
- 45 Christopher Dr Unit 106
- 17 Ferry Rd
- 6 Ferry Rd
- 29 Bradstreet Ave
- 10 Fenwick Cir
- 51 Ford St Unit A
- 5 Pilgrim Cir Unit C
- 27 Russell Farm Dr
- 183 Farrwood Dr
- 30 Anderson Dr
- 414 Farrwood Dr Unit 414
- 524 Merrimack St
- 128 Pleasant Valley St
- 201 Aberdeen Rd
- 396 Oak St
- 68 Ashford St
- 1 Riverview Blvd Unit 8-203
- 1 Riverview Blvd Unit 1:209
- 1 Riverview Blvd Unit 4-203
Your Personal Tour Guide
Ask me questions while you tour the home.