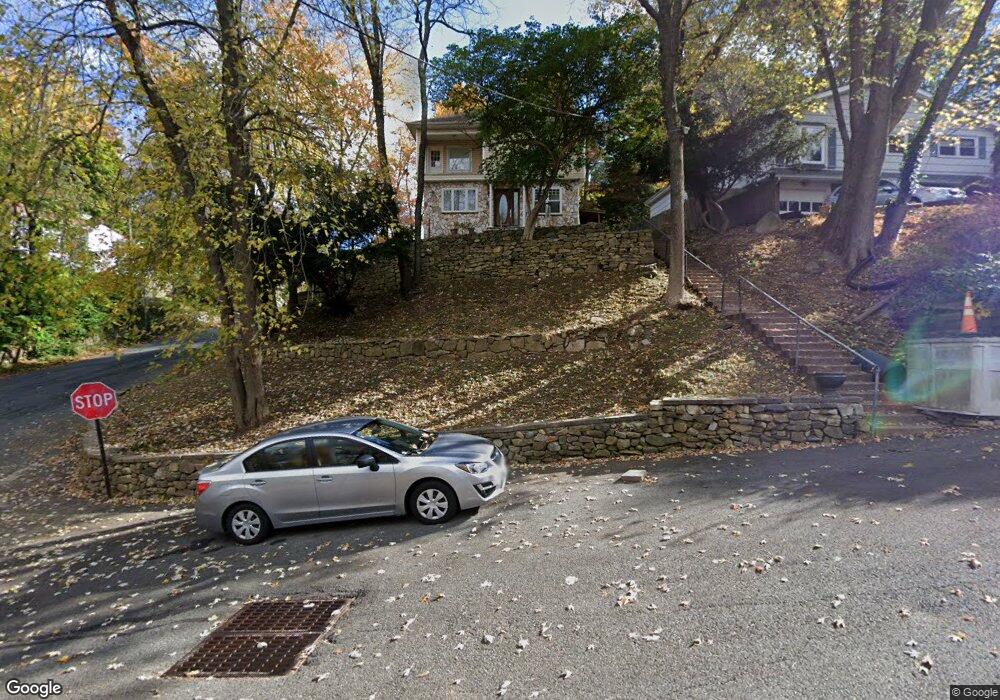
8 Cobb Place Landing, NJ 07850
Estimated Value: $410,000 - $487,000
--
Bed
--
Bath
1,646
Sq Ft
$274/Sq Ft
Est. Value
About This Home
This home is located at 8 Cobb Place, Landing, NJ 07850 and is currently estimated at $450,776, approximately $273 per square foot. 8 Cobb Place is a home located in Morris County with nearby schools including Eisenhower Middle School, Lincoln Roosevelt Elementary School, and Roxbury High School.
Ownership History
Date
Name
Owned For
Owner Type
Purchase Details
Closed on
Dec 13, 2006
Sold by
Hud
Bought by
Meta Dzafera
Current Estimated Value
Purchase Details
Closed on
Mar 27, 2006
Sold by
Washington Mutual Bank
Bought by
Secretary Of Housing And Dev
Create a Home Valuation Report for This Property
The Home Valuation Report is an in-depth analysis detailing your home's value as well as a comparison with similar homes in the area
Home Values in the Area
Average Home Value in this Area
Purchase History
| Date | Buyer | Sale Price | Title Company |
|---|---|---|---|
| Meta Dzafera | $145,600 | None Available | |
| Secretary Of Housing And Dev | -- | -- |
Source: Public Records
Tax History Compared to Growth
Tax History
| Year | Tax Paid | Tax Assessment Tax Assessment Total Assessment is a certain percentage of the fair market value that is determined by local assessors to be the total taxable value of land and additions on the property. | Land | Improvement |
|---|---|---|---|---|
| 2025 | $6,658 | $242,200 | $61,000 | $181,200 |
| 2024 | $6,554 | $242,200 | $61,000 | $181,200 |
| 2023 | $6,554 | $242,200 | $61,000 | $181,200 |
| 2022 | $6,380 | $242,200 | $61,000 | $181,200 |
| 2021 | $6,380 | $242,200 | $61,000 | $181,200 |
| 2020 | $6,367 | $242,200 | $61,000 | $181,200 |
| 2019 | $7,085 | $274,600 | $81,400 | $193,200 |
| 2018 | $5,577 | $129,400 | $50,000 | $79,400 |
| 2017 | $5,547 | $129,400 | $50,000 | $79,400 |
| 2016 | $5,439 | $129,400 | $50,000 | $79,400 |
| 2015 | $5,304 | $129,400 | $50,000 | $79,400 |
| 2014 | $5,220 | $129,400 | $50,000 | $79,400 |
Source: Public Records
Map
Nearby Homes
- 21 Laurie Rd
- 5 Zachary Dr
- 33 Ford Rd Unit 35
- 16 Esposito Ln
- 504 Ryerson Rd
- 90 Salmon Rd
- 512 Colver Rd
- 505 Logan Dr
- 545 Rogers Dr
- 537 Dell Rd
- Oakmont Grand Plan at Stone Water Village
- Roanoke Plan at Stone Water Village
- Powell Plan at Stone Water Village
- 2 Zachary Dr
- 181 Orben Dr
- 649 Henmar Dr
- 547 Atlas Rd
- 627 E Vail Rd
- 137 Lakeside Blvd
- 592 Dell Rd